

Our data shows traders are now net-long Wall Street for the first time since Mar 28, 2023 when Wall Street traded near 32,430.10.
Number of traders net-short has decreased by 29.32% from last week.
| SYMBOL | TRADING BIAS | NET-LONG% | NET-SHORT% | CHANGE IN LONGS | CHANGE IN SHORTS | CHANGE IN OI |
|---|---|---|---|---|---|---|
| Wall Street | BEARISH | 51.10% | 48.90% |
43.03% Daily 40.22% Weekly |
-18.90% Daily -29.32% Weekly |
4.14% Daily -5.33% Weekly |
| Change in | Longs | Shorts | OI |
| Daily | 45% | -22% | 3% |
| Weekly | 46% | -34% | -8% |
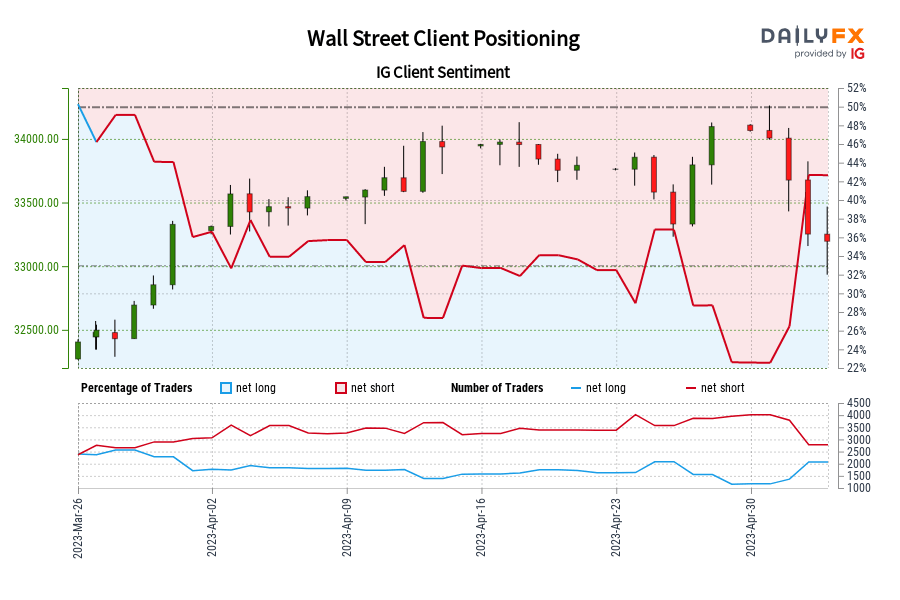
Wall Street: Retail trader data shows 51.10% of traders are net-long with the ratio of traders long to short at 1.04 to 1. In fact, traders have remained net-long since Mar 28 when Wall Street traded near 32,430.10, price has moved 2.36% higher since then. The number of traders net-long is 43.03% higher than yesterday and 40.22% higher from last week, while the number of traders net-short is 18.90% lower than yesterday and 29.32% lower from last week.
We typically take a contrarian view to crowd sentiment, and the fact traders are net-long suggests Wall Street prices may continue to fall.
Our data shows traders are now net-long Wall Street for the first time since Mar 28, 2023 when Wall Street traded near 32,430.10. Traders are further net-long than yesterday and last week, and the combination of current sentiment and recent changes gives us a stronger Wall Street-bearish contrarian trading bias.
Comments are closed.