
Missed the bearish triangle break on USD/CHF?
You might still have a chance to catch the retest of the former support if you’re thinking of shorting!
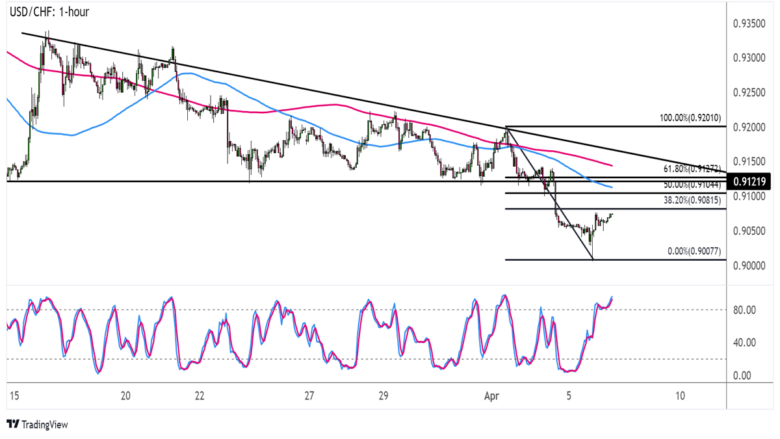
Here are the pullback levels I’m watching.

USD/CHF 1-hour Forex Chart by TradingView
Retracement alert!
After breaking below its descending triangle bottom, USD/CHF looks prime for a pullback to the broken support zone.
This happens to be right around the 61.8% Fibonacci retracement level and 100 SMA dynamic inflection point, adding to its strength as a potential ceiling.
A shallow pullback might already find sellers at the 38.2% Fib around the .9080 level or the 50% retracement near the .9100 major psychological mark.
If any of these Fibs are enough to keep gains in check, USD/CHF could set its sights back on the swing low close to the .9000 handle or lower.
Technical indicators are in favor of more losses, too. The 100 SMA is below the 200 SMA to reflect the presence of bearish vibes while Stochastic is in the overbought zone to signal exhaustion among buyers.
Fundamentals are also pointing to more losses for the dollar since Uncle Sam has been churning out one downbeat jobs report after another.
Earlier on, the JOLTS job openings figure for February pointed to a likely slowdown in hiring for the coming months while the ADP report and ISM services PMI are hinting at a downside NFP surprise.
If that’s the case, traders could further downgrade Fed tightening hopes and let go of their dollar holdings, so watch out!
This content is strictly for informational purposes only and does not constitute as investment advice. Trading any financial market involves risk. Please read our Risk Disclosure to make sure you understand the risks involved.
Comments are closed.