XNG/USD struggles to defend bounce off 100-DMA near $2.60
- Natural Gas remains sidelined after rising the most in a week.
- Bearish MACD signals, steady RSI prod XNG/USD bulls below three-week-old resistance line.
- Previous support line, tops marked in June and March prod Natural Gas buyers from retaking control.
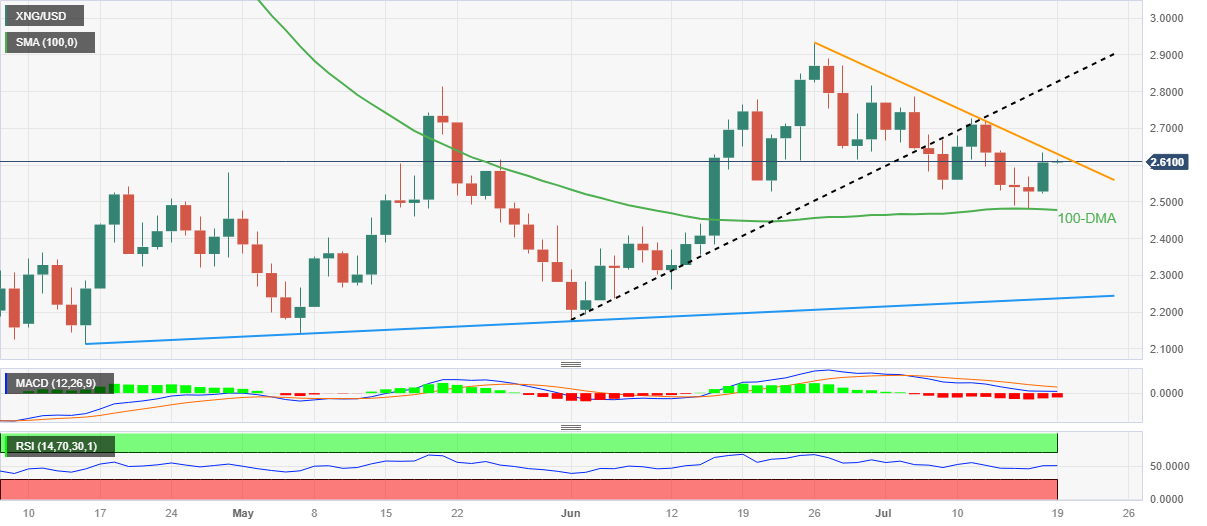
Natural Gas Price (XNG/USD) remains sidelined near $2.60-61 during the early hours of Wednesday’s Asian session, following a stellar rebound from the 100-DMA. In doing so, the energy instrument justifies the bearish MACD signals, as well as the steady RSI (14) line.
Apart from that, a downward-sloping resistance line from June 26, close to $2.63 also challenges the XNG/USD bulls.
Following that, $2.70 and $2.80 round figures may entertain the Natural Gas buyers before directing them to May’s peak of around $2.81.
It’s worth noting that the XNG/USD bulls remain cautious unless witnessing a clear upside break of the seven-week-long previous support line, close to $2.82 by the press time.
Even if the commodity manages to remain firmer past $2.82, the previous monthly high and March’s top, respectively near $2.93 and 3.07 will act as additional upside filters to challenge the buyers.
On the flip side, three-month-old horizontal support near $2.53-52 restricts the short-term downside of the Natural Gas Price ahead of the 100-DMA support of around $2.47.
It should be observed, however, that a daily closing beneath the key DMA won’t hesitate to portray a gradual south-run toward an upward-sloping support line from April, close to $2.23 at the latest.
Natural Gas Price: Daily chart
Trend: Limited upside expected


Comments are closed.