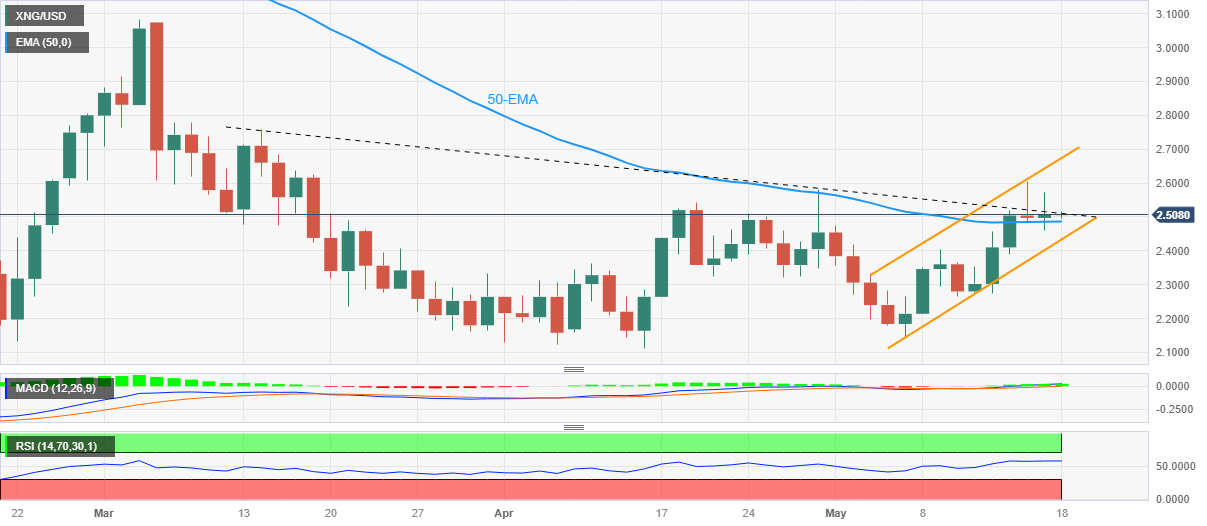
XNG/USD grinds between 50-EMA and crucial resistance line near $2.50
- Natural Gas remains indecisive within fortnight-old bullish channel.
- 50-EMA, descending resistance line from mid-March restrict immediate XNG/USD moves.
- Gradually rising RSI line, recently upbeat MACD signals favor Natural Gas buyers.
Natural Gas Price (XNG/USD) treads water around $2.51 heading into Thursday’s European session. In doing so, the XNG/USD remains defensive between the 50-day Exponential Moving Average (EMA) and a two-month-long falling resistance line.
That said, the energy instrument portrays sluggish moves after it rose to the highest level since March 17 on Tuesday. However, the XNG/USD stays within a two-week-old ascending trend channel and hence keeps the Natural Gas buyers hopeful.
It’s worth noting that the recently firmer MACD signals join the gradually rising RSI (14) line, not overbought, to underpin the bullish bias surrounding the Natural Gas price.
As a result, the XNG/USD quote is likely to cross the immediate resistance line, around $2.52 by the press time, which in turn could help the bulls to prod the latest multi-day high of near $2.60.
Though, the aforementioned channel’s top line, close to $2.68 at the latest, may challenge the Natural Gas buyers afterward.
Meanwhile, pullback moves need validation from the 50-EMA support of near $2.48, a break of which could quickly drag the XNG/USD towards the stated channel’s bottom line surrounding $2.43.
In a case where the Natural Gas price remains weaker past $2.43, a quick fall to the early month top of $2.40 can’t be ruled out.
Overall, XNG/USD remains on the bull’s radar despite the latest inaction.
Natural Gas Price: Daily chart
Trend: Further upside expected


Comments are closed.