

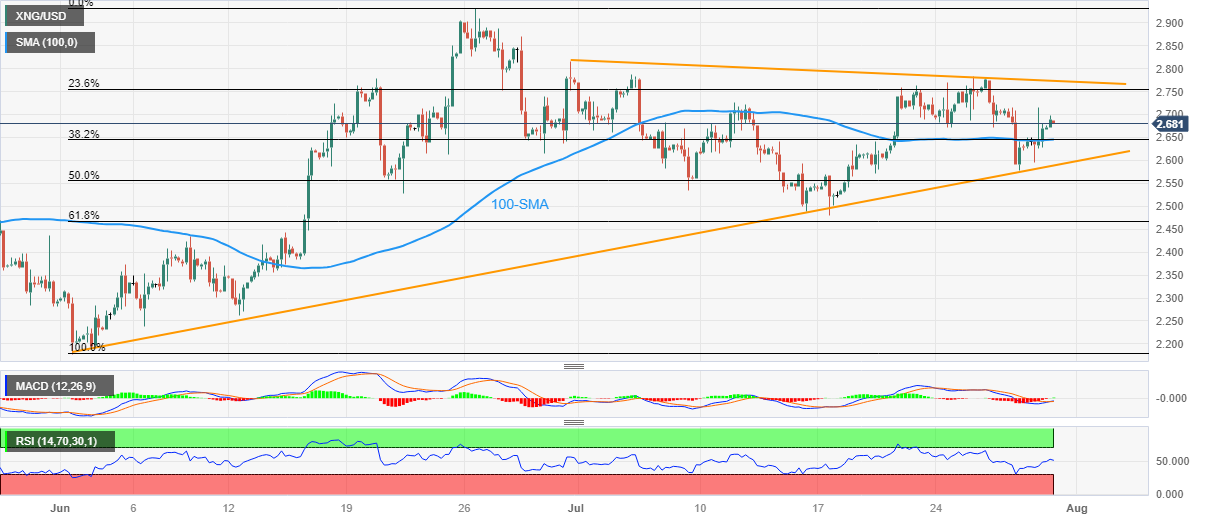
- Natural Gas picks up bids to reverse the previous weekly loss within a bearish chart formation.
- Sustained trading beyond 100-SMA, mixed oscillators keep XNG/USD bears hopeful.
- Clear downside break of $2.59 could convince Natural Gas sellers to refresh monthly low.
Natural Gas Price (XNG/USD) remains mildly bid near $2.68 amid early Monday morning in Asia. In doing so, the XNG/USD pares the previous weekly loss with mild losses, up 0.45% intraday, as sellers flex muscles within bearish chart formation.
That said, the XNG/USD’s sluggish MACD signals join the gradually improving XNG/USD price. However, the Natural Gas buyers need validation from the downward-sloping resistance line stretched from late June, close to $2.77 by the press time.
Following that, the XNG/USD run-up towards the previous monthly high of around $2.93 and March’s peak of near $3.08 will be in the spotlight.
On the contrary, a clear downside break of the 100-SMA, around $2.65 at the latest, becomes necessary for the XNG/USD bears to retake control.
Even so, the Natural Gas trading beneath the stated triangle’s bottom line, close to $2.59 at the latest, will be a tough nut to crack for the energy instrument before giving them control.
Following that, $2.43 and the previous monthly low of around $2.17 may test the XNG/USD bears before directing them to the theoretical target of below the $2.00 psychological magnet, close to $1.90.
Overall, XNG/USD remains bearish but the downside move needs validation from $2.59 to convince the energy bears.
Natural Gas Price: Four-hour chart
Trend: Limited downside expected
Comments are closed.