XNG/USD drops to $2.37 within nearby descending triangle
- Natural Gas price remains pressured after snapping two-day winning streak.
- 50-DMA adds strength to $2.45 upside hurdle, 21-DMA acts as additional support.
- Sluggish oscillators suggest continuation of further XNG/USD grind within bullish chart formation.
Natural Gas Price (XNG/USD) holds lower grounds near $2.37 during the early hours of Tuesday, after posting the first daily loss in three the previous day.
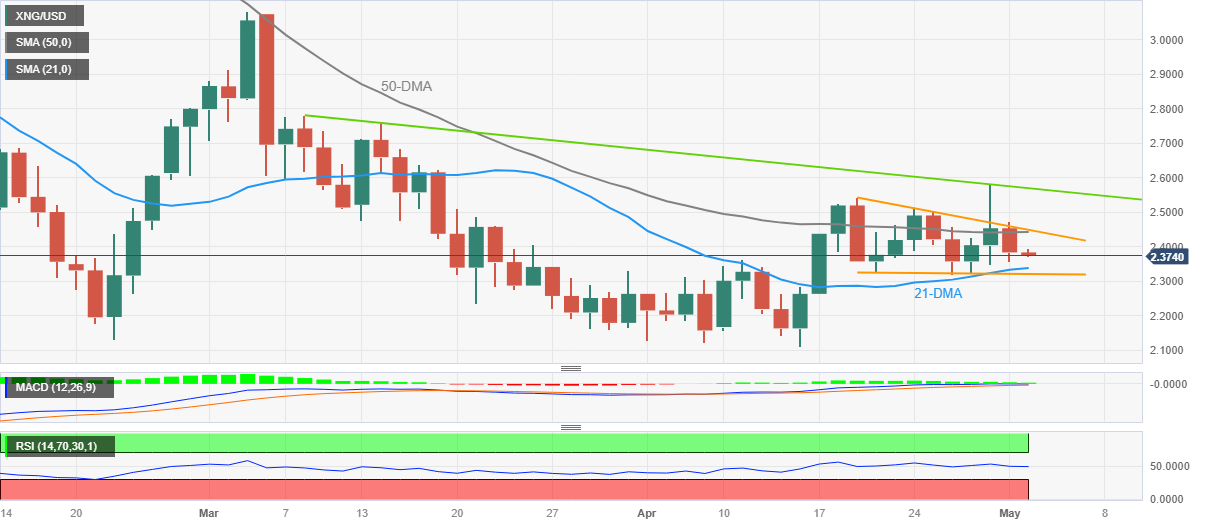
In doing so, the XNG/USD price remains inside a two-week-old descending triangle formation amid sluggish MACD signals and steady RSI (14).
As a result, the Natural Gas Price is likely to remain sideways within a bullish chart pattern, currently between $2.45 and $2.32. That said, the 50-DMA adds strength to the $2.45 upside hurdle.
It’s worth noting that an upside break of $2.45 won’t hesitate to challenge a downward-sloping resistance line from March 08, close to $2.57. Following that, the six-week high marked on Friday at around $2.58 can act as the last defense of the Natural Gas sellers.
On the contrary, the 21-DMA level of around $2.33 restricts the immediate downside of the XNG/USD price before directing the energy instrument towards the bottom of the stated triangle, near $2.32.
Should the quote remains bearish past $2.32, the yearly low marked in April around $2.11 and the $2.00 psychological magnet will gain the market’s attention.
Overall, the Natural Gas Price remains on the bull’s radar despite the latest pullback in the quote.
Natural Gas Price: Daily chart
Trend: Further consolidation expected


Comments are closed.