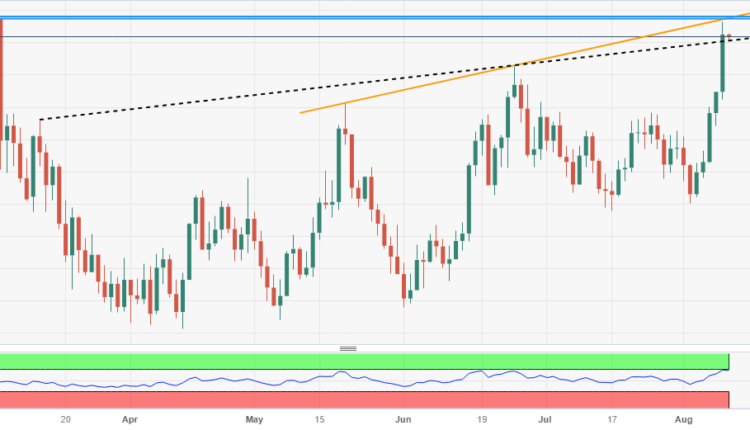
XNG/USD bulls run out of steam below $3.08 key resistance
- Natural Gas Price retreats from five-month high, prints the first daily loss in six.
- Overbought RSI prods XNG/USD bulls as multi-day-old horizontal resistance area joins rising trend line from May.
- Energy sellers need validation from previous resistance line stretched from March 14.
Natural Gas Price (XNG/USD) prints mild losses around $3.00 during early Thursday as it braces for the US inflation data at the highest level in five months.
In doing so, the XNG/USD not only justifies the pre-data consolidation but also portrays the failure to cross a convergence of the five-month-old horizontal resistance area and an ascending trend line from May, close to $3.08.
Also challenging the bullish bias about the Natural Gas Price is the overbought RSI (14) line.
It’s worth noting, however, that the XNG/USD sellers must offer a daily closing beneath a rising strength from Mach 14, close to $3.00 at the latest, to retake control.
Even so, June’s peak of $2.93 and May’s high surrounding $2.81 can test the Natural Gas bears before giving them control.
On the contrary, a daily closing beyond the $3.08 resistance confluence could quickly direct the XNG/USD buyers toward the 200-DMA hurdle of around $3.37.
Should the Natural Gas buyers occupy the driver’s seat past $3.37, the $4.00 round figure and the yearly high of near $4.17 will be in the spotlight.
Overall, Natural Gas seeks a pullback in prices before resuming a fresh upside toward crossing the immediate key resistance confluence.
Natural Gas Price: Daily chart
Trend: Pullback expected


Comments are closed.