XNG/USD bulls attack $2.75 hurdle as full markets return
- Natural Gas picks up bids to defend the previous day’s recovery, mildly bid of late.
- 200-HMA, top line of a fortnight-old symmetrical triangle restricts XNG/USD upside.
- Bullish MACD signals, upbeat RSI keeps Natural Gas buyers hopeful.
- Downside break of $2.66 can recall XNG/USD bears.
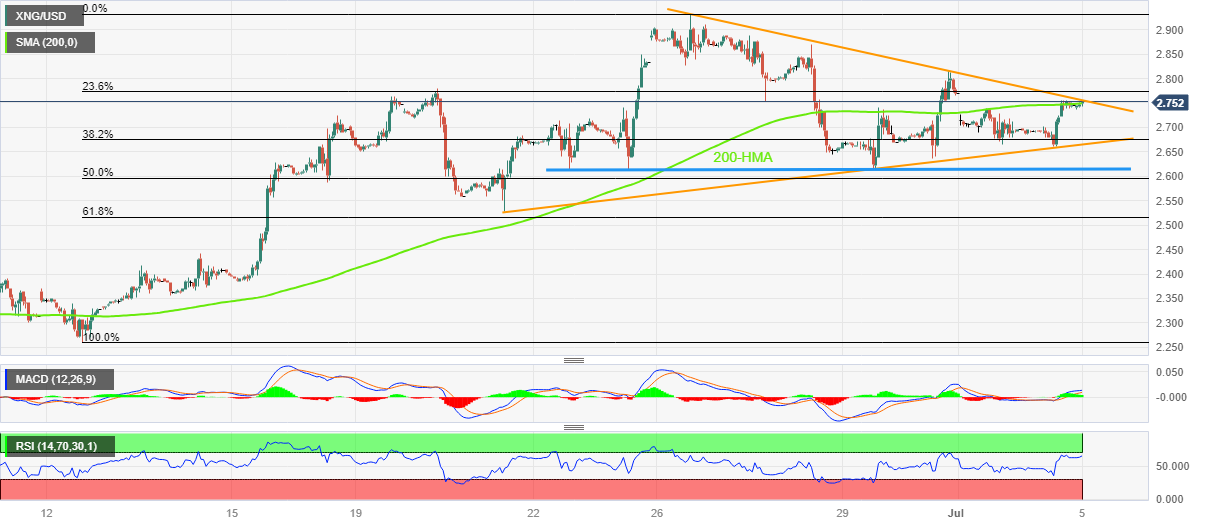
Natural Gas (XNG/USD) Price remains on the front foot around $2.75 amid early Wednesday, extending the previous day’s run-up during a sluggish Asian session.
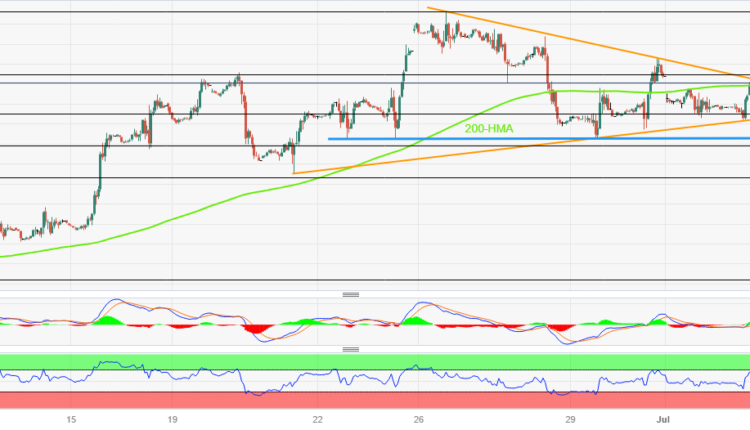
In doing so, the Natural Gas Price jostles with a convergence of the 200-Hour Moving Average (HMA) and the top line of a two-week-long symmetrical triangle, close to $2.75 at the latest.
That said, the bullish MACD signals and the upbeat RSI (14) line, not overbought, suggest further upside of the XNG/USD price past the $2.75 hurdle.
In that case, Friday’s peak of near $2.82 may act as an intermediate check for the Natural Gas run-up targeting the previous monthly high of around $2.93.
It’s worth noting that further advances of the Natural Gas price past $2.93 appear elusive as the $3.00 round figure and March’s peak of $3.08 will be tough nuts to crack for the XNG/USD bulls afterward.
Meanwhile, pullback moves remain elusive unless staying within the aforementioned triangle, currently between $2.75 and $2.66.
Also acting as the downside filter for the Natural Gas Price is the horizontal support around $2.60, a break of which will welcome the XNG/USD bears.
Natural Gas Price: Hourly chart
Trend: Further upside expected


Comments are closed.