
Gold, Retail Trader Positioning, Technical Analysis – IGCS Update
- Gold prices have climbed for another day
- Retail traders starting to turn more bearish
- Will XAU/USD confirm trendline breakout?
Recommended by Daniel Dubrovsky
Get Your Free Gold Forecast
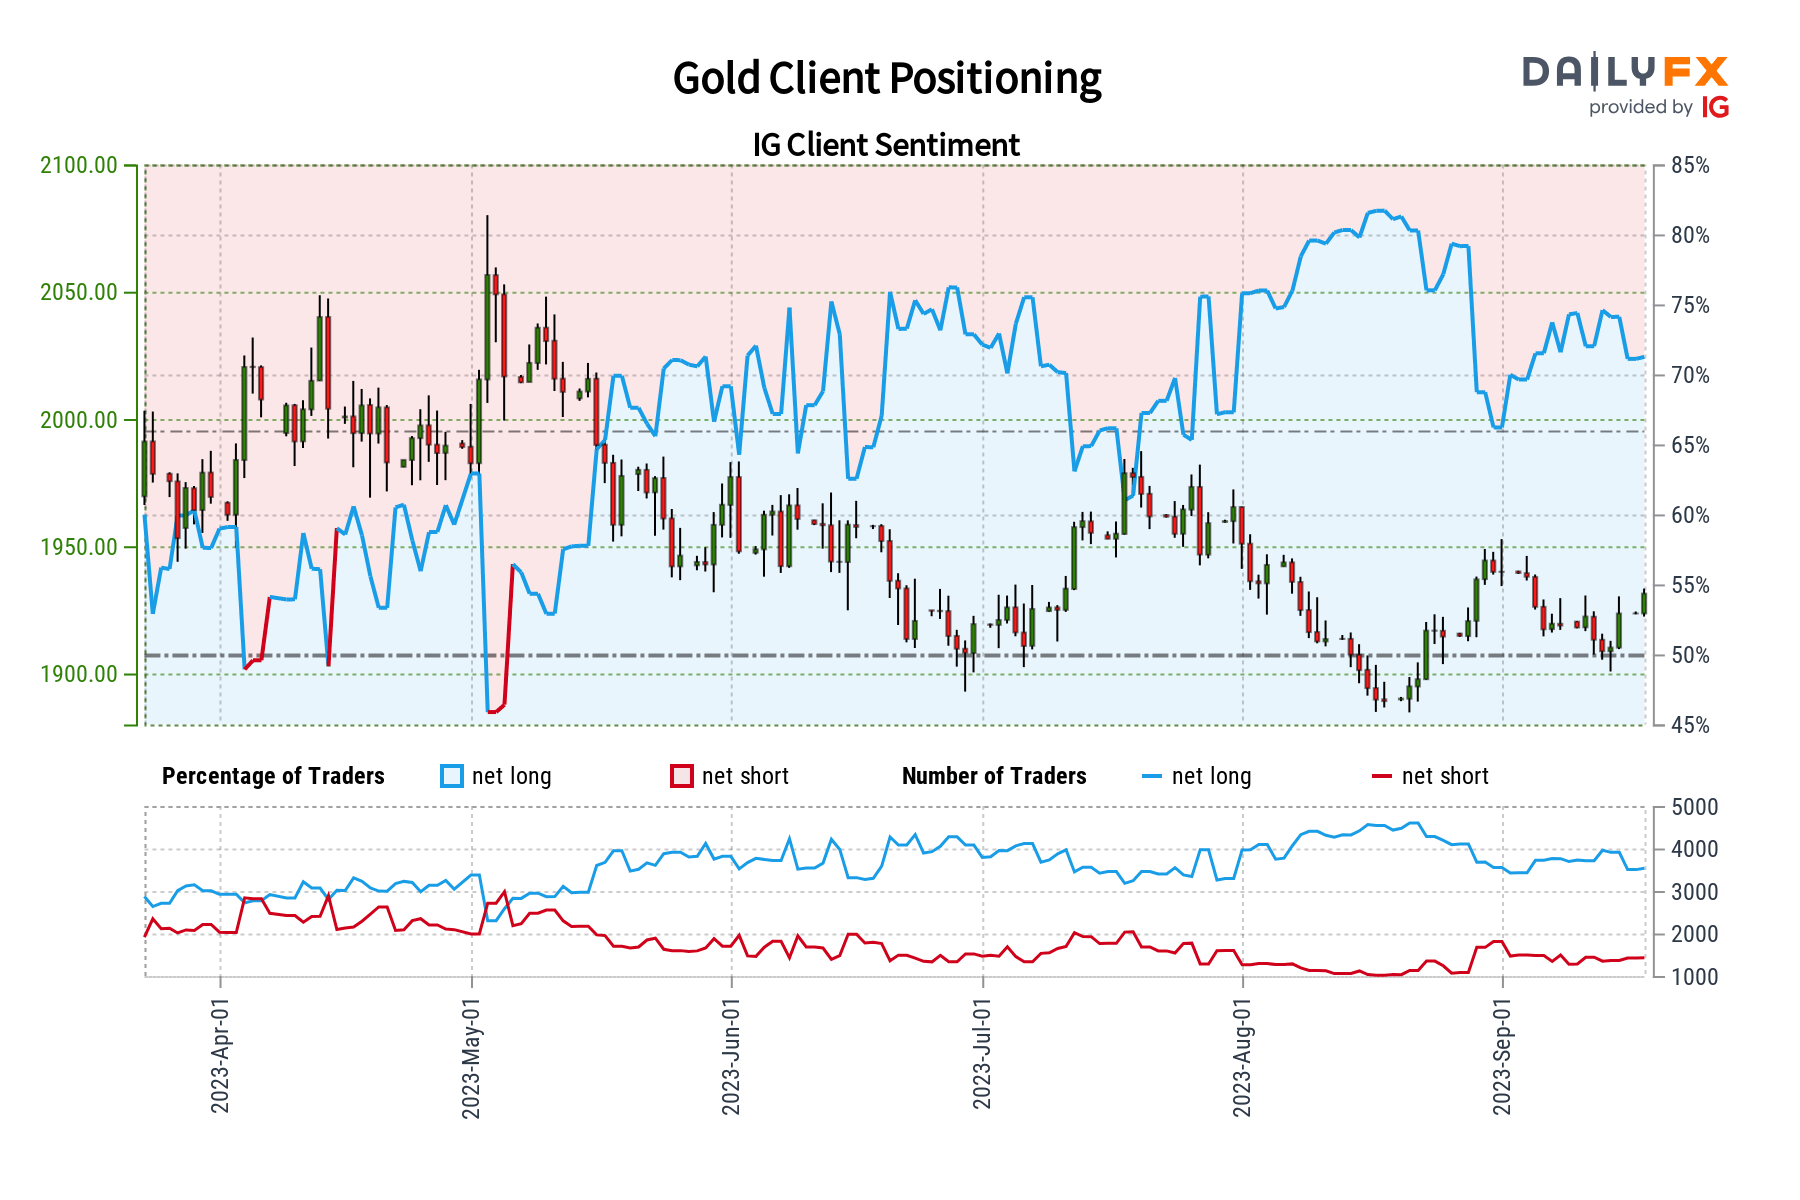
Gold prices have rallied for a couple of trading sessions and retail traders have responded by increasing their downside exposure. This can be seen by looking at IG Client Sentiment (IGCS), which often functions as a contrarian indicator. With that in mind, will an increasing shift in retail exposure offer a warm welcome for the yellow metal?
Gold Sentiment Outlook – Bullish
The IGCS gauge shows that about 70% of retail traders are net-long gold. Since the majority of them are biased to the upside, this still could spell trouble for gold down the road. That said, downside exposure has increased by 9.49% and 3.59% compared to yesterday and last week, respectively. With that in mind, recent changes in exposure hint that the price trend may soon reverse higher.
| Change in | Longs | Shorts | OI |
| Daily | 4% | 9% | 6% |
| Weekly | -1% | 4% | 1% |

XAU/USD Daily Chart
On the daily chart, recent gains have pushed gold prices to flirt confirming a breakout above the falling trendline from May. Immediate resistance is the 1936.90 inflection point. A push above that exposes the 23.6% Fibonacci retracement level of 1971.63, opening the door to an increasingly bullish technical bias.
Otherwise, a false breakout places the focus back on the 38.2% point around 1903.46 before exposing the August swing low of 1884.37. Confirming a breakout under the latter opens the door to extending the downtrend since May.
Recommended by Daniel Dubrovsky
How to Trade Gold
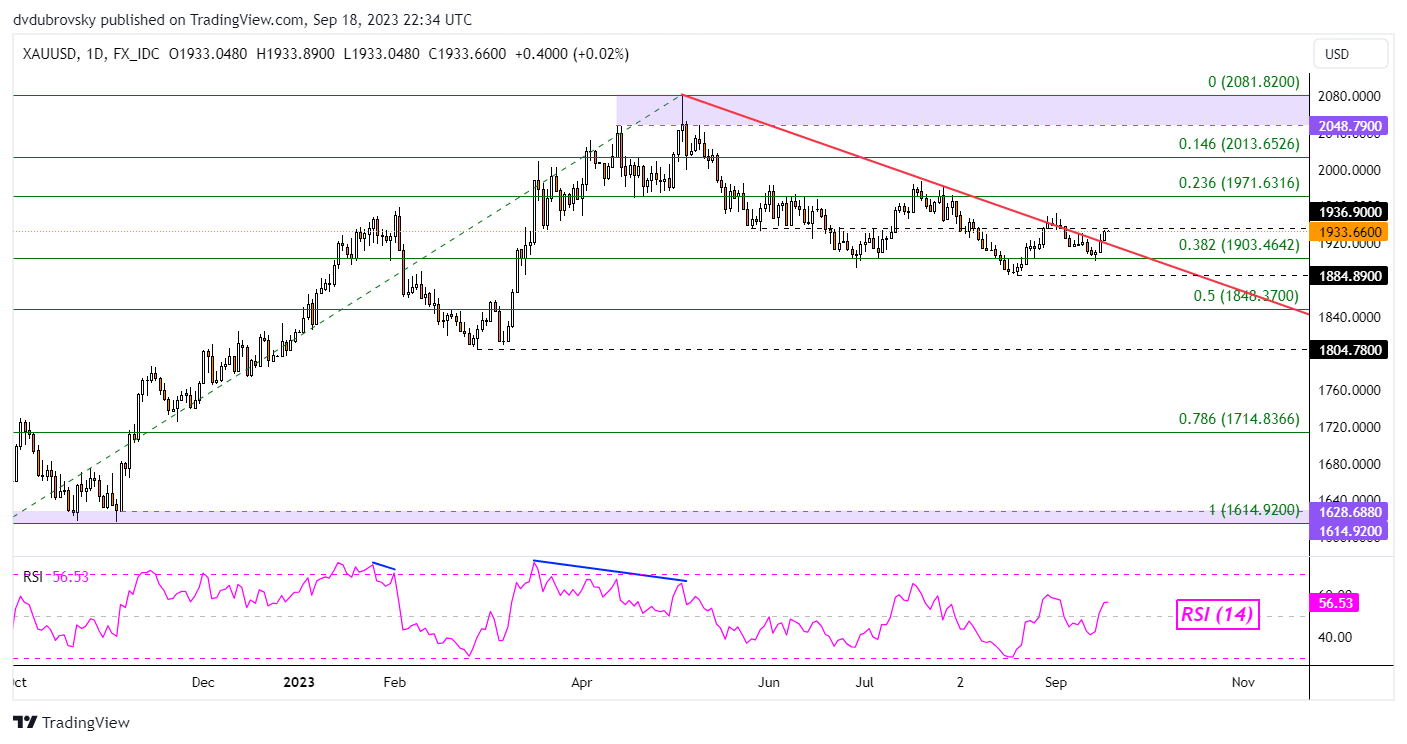
Chart Created in Trading View
— Written by Daniel Dubrovsky, Senior Strategist for DailyFX.com
Comments are closed.