XAG/USD turns vulnerable below $23.55 confluence support
- Silver remains under some selling pressure for the second successive day on Monday.
- The intraday break below the $23.55 confluence supports prospects for further losses.
- A sustained strength beyond the $24.00 mark is needed to offset the negative outlook.
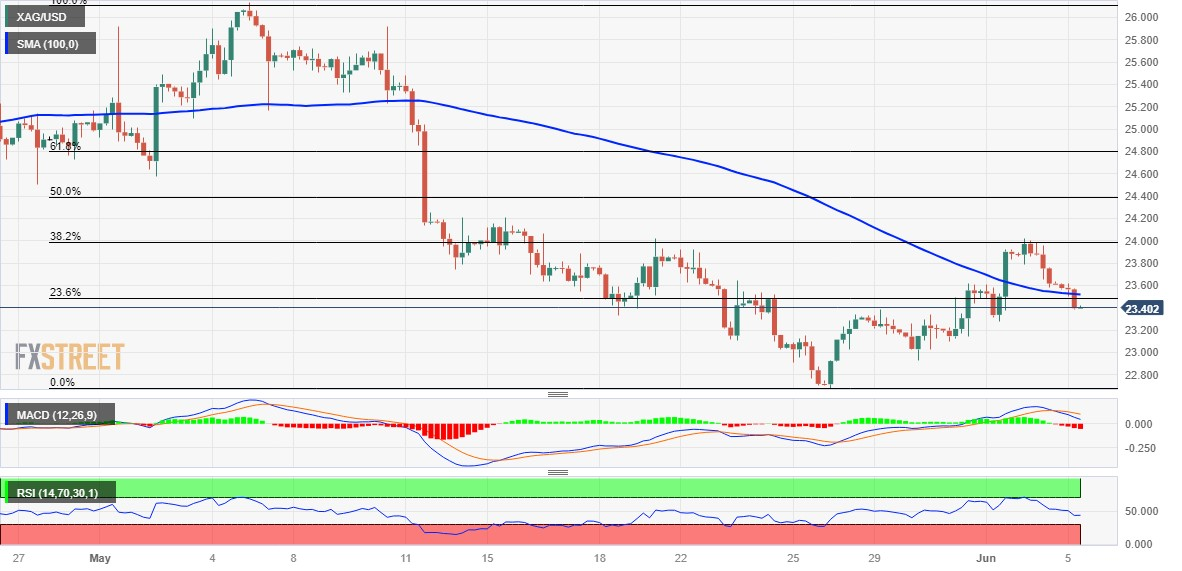
Silver extends Friday's rejection slide from the $24.00 mark, or the 38.2% Fibonacci retracement level of the downfall witnessed in May and drifts lower for the second successive day. The white metal maintains its offered tone, just below the $23.50 level through the early European session on Monday and seems vulnerable to weaken further.
From a technical perspective, the intraday slide drags the XAG/USD below the $23.55 confluence support, comprising the 23.6% Fibo. level and the 100-period Simple Moving Average (SMA) on the 4-hour chart. Moreover, bearish oscillators on daily/4-hour charts add credence to the negative outlook and support prospects for a further intraday depreciating move.
Hence, a subsequent slide, towards testing the $23.00 round figure, looks like a distinct possibility. Some follow-through selling will expose the $22.70-$22.65 region, or over a two-month low touched in May, below which the XAG/USD could eventually drop to the $22.00 mark. The latter represents the very important 200-day SMA and should act as a pivotal point.
On the flip side, sustained strength beyond the $23.55 confluence support breakpoint could allow the XAG/USD to make a fresh attempt towards conquering the $24.00 mark. This is closely followed by the $24.15-$24.20 horizontal resistance, above which the momentum could push the commodity further towards the 50% Fibo. level, around the $24.45-$24.50 region.
The XAG/USD might eventually climb to the $24.80 zone, or the 61.8% Fibo. level, and aim to reclaim the $25.00 psychological mark for the first time since May 11. The upward trajectory could get extended further towards the $25.30-$25.35 supply zone en route to the $26.00 round figure and over a one-year high, around the $26.10-$26.15 area touched in May.
Silver 4-hour chart

Key levels to watch


Comments are closed.