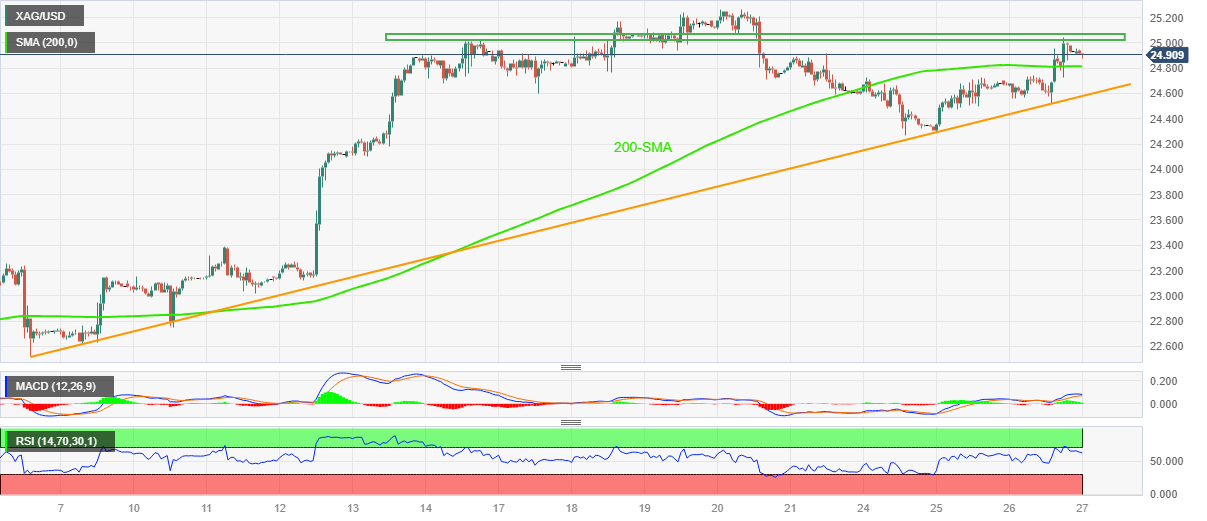
XAG/USD snaps two-day uptrend below $25.00, focus on 200-SMA and US GDP
- Silver Price retreats from fortnight-old resistance to print the first daily loss in three.
- RSI pullback from overbought territory, looming bear cross on MACD tease XAG/USD sellers.
- 200-SMA, three-week-old rising support line challenges Silver bears before putting them in the driver’s seat.
- US GDP, Durable Goods Orders need to back recently hawkish Fed concerns to defend XAG/USD sellers.
Silver Price (XAG/USD) sticks to mild losses around $24.90 amid early Thursday morning in Asia, after rising in the last two consecutive days to refresh the weekly top.
That said, the XAG/USD’s latest pullback could be linked to the metal’s inability to cross a two-week-old horizontal resistance area around $25.00-05 by the press time.
Also luring the Silver sellers is the looming bear cross on the MACD and the RSI (14) line’s retreat from the overbought territory.
However, the 200-SMA level of around $24.80 restricts further downside of the XAG/USD, a break of which will highlight an upward-sloping support line from early July, close to $24.55 at the latest, for the Silver sellers to watch.
In a case where the Silver Price remains bearish past $24.55, the weekly bottom of around $24.25 will act as the final defense of the Silver buyers.
Meanwhile, a clear upside break of the aforementioned horizontal resistance area surrounding $25.00-05 will need validation from the monthly peak close to $25.30 to welcome the XAG/USD bulls.
Following that, a run-up to challenge the yearly top of around $26.15 will be in the spotlight.
Overall, the market’s cautious mood ahead of the first readings of the US Gross Domestic Product (GDP) for the second quarter (Q2), US Durable Goods Orders for June and the monetary policy meeting of the European Central Bank (ECB) prod the Silver buyers of late.
Silver Price: Hourly chart
Trend: Further downside expected


Comments are closed.