XAG/USD resiliently rebounds, claims $23.00 amidst high US bond yields
- Silver price returns from two-month lows, crosses the 200-day EMA and $23 threshold and ends the week with a 2.89% loss.
- Despite US data supporting another Fed rate hike and subsequent rise in Treasury bond yields, silver price sustains an upward trajectory, targeting the 100-day EMA.
- With the Relative Strength Index indicating potential silver weakness, downside risk remains.
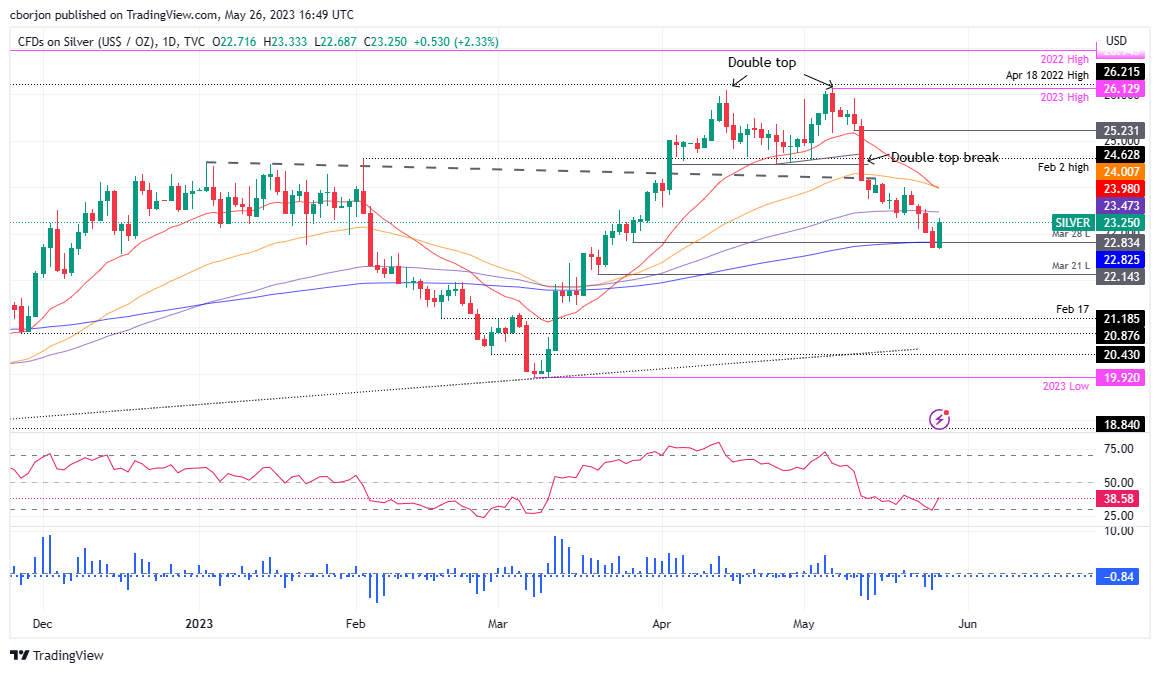
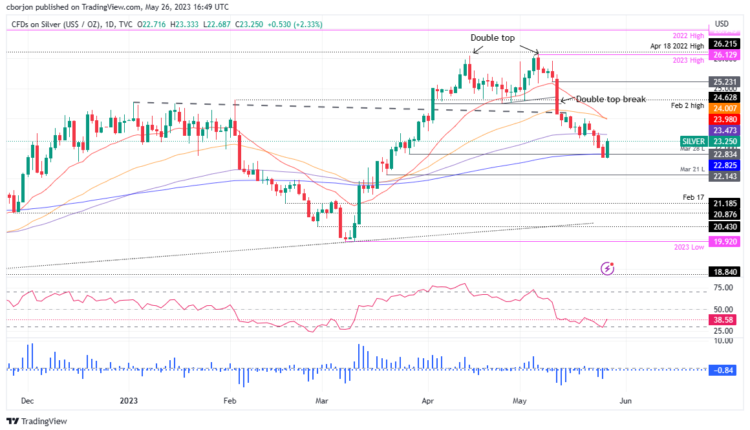
Silver price bounces off two-month-lows hit at $22.68, rallies sharply, and claims the 200-day Exponential Moving Average (EMA) at $22.82 and the $23.00 psychological figure on Friday’s mid-North American session. Although the white metal is gaining more than 1.90%, it is set to finish the week with losses of 2.89%. At the time of writing, XAG/USD is trading at $23.15.
Silver Price Analysis: XAG/USD technical outlook
Even though economic data from the United States (US) justifies another rate hike by the US Federal Reserve (Fed). Therefore, US Treasury bond yields are rising, underpinning the greenback. However, the XAG/USD ignored most factors that could drag the price low and rip higher, eyeing the 100-day Exponential Moving Average (EMA) at $23.47.
Nevertheless, the Relative Strength Index (RSI) is in bearish territory, warranting further Silver weakness, while the 3-day Rate of Change (RoC) has yet to reach neutral levels. Therefore, additional downside could be expected.
However, if XAG/USD clears the 100-day EMA, it would face sold resistance at the confluence of the 20 and 50-day EMAs at around $23.97-24.00. Once broken, the next supply zone would be the $25.00 mark.
On the flip side, and the path of least resistance in the near term, the XAG/USD first support would be $23.00, followed by $22.68, the current week’s low. A beach of the latter will expose the March 21 swing low of $22.14.
Silver Price Action – Daily chart


Comments are closed.