

- Silver stages a modest recovery from a nearly one-month low touched on Monday.
- The technical setup favours bearish traders and supports prospects for further losses.
- A sustained strength beyond the $24.00 mark is needed to negate the bearish bias.
Silver attracts some buying on Tuesday and recovers a part of the previous day's heavy losses to the $23.00 round-figure mark, or nearly a one-month low. The white metal, however, struggles to capitalize on the move and seesaws between tepid gains/minor losses through the early European session. Moreover, the technical setup suggests that the path of least resistance for the XAG/USD is to the downside.
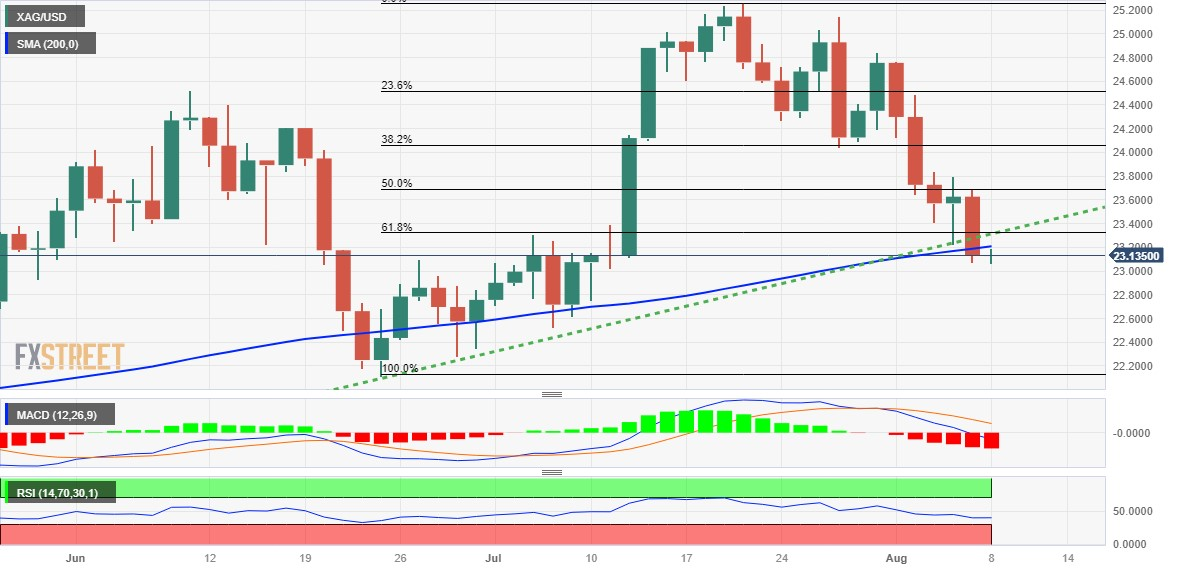
The overnight breakdown below the $23.30 confluence, comprising the 61.8% Fibonacci retracement level of the June-July rally and an ascending trend-line extending from a multi-month low touched in June, was seen as a fresh trigger for bearish traders. A subsequent slide below a technically significant 200-day Simple Moving Average (SMA) might have already set the stage for an extension of the recent decline from over a two-month top touched in July.
The negative outlook is reinforced by the fact that oscillators on the daily chart have just started drifting into bearish territory. That said, it will still be prudent to wait for some follow-through selling and acceptance below the $23.00 mark before placing fresh bearish bets. The XAG/USD might then accelerate the slide towards the $22.15-$22.10 area. This is followed by the $22.00 mark, which if broken decisively should pave the way for deeper losses.
On the flip side, the aforementioned confluence support breakpoint, around the $23.30 area, now seems to act as an immediate barrier. A sustained strength beyond might trigger a short-covering rally towards the $23.70 area or the 50% Fibo. level. The attempted recovery, however, is likely to attract fresh sellers and remain capped near another confluence comprising the 100-day SMA and the 38.2% Fibo. level, around the $24.00-$24.10 region.
The latter should act as a pivotal point, which if cleared decisively could lift the XAG/USD back towards the 23.6% Fibo. level, around the $24.45-$24.50 supply zone, en route to the $24.75 hurdle and the $25.00 psychological mark.
Silver daily chart
Technical levels to watch
Comments are closed.