XAG/USD consolidates around $25.30-35 area, bullish potential intact
- Silver lacks any firm directional bias and oscillates in a range above the $25.00 mark.
- The technical setup favours bullish traders and supports prospects for further gains.
- Dips towards $24.65 confluence support might still be seen as a buying opportunity.
Silver attracts some dip-buying in the vicinity of the $25.00 psychological mark and touches a three-day high on Thursday, albeit the intraday uptick lacks bullish conviction. The white metal seesaws between tepid gains/minor losses through the early North American session and is currently placed around the $25.30 region, nearly unchanged for the day.
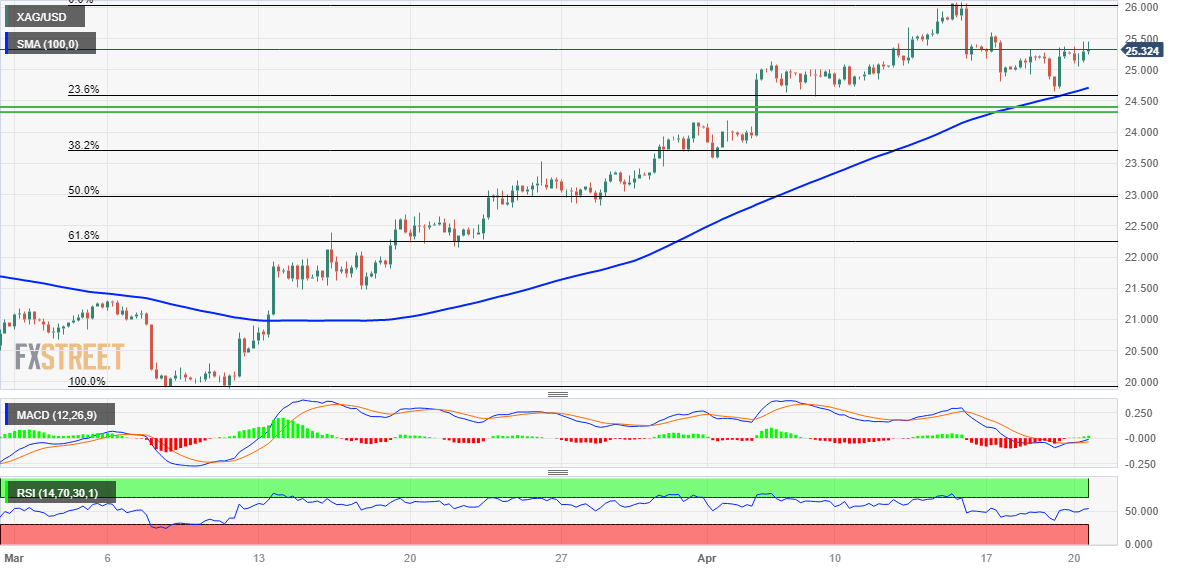
From a technical perspective, the recent pullback from over a one-year high – levels just above the $26.00 round figure touched last week – stalled on Wednesday near the 23.6% Fibonacci retracement level of the March-April rally. The said support, around the $24.65 region, now coincides with the upward sloping 100-period Simple Moving Average (SMA) on the 4-hour chart and should act as a pivotal point.
Meanwhile, oscillators on the daily chart are holding comfortably in the bullish territory and have just started gaining positive traction on the 4-hour chart. This, in turn, favours bullish traders and supports prospects for the resumption of the recent rally witnessed over the past month or so. Hence, some follow-through strength towards the $25.80 hurdle, en route to the $26.00 mark, looks like a distinct possibility.
On the flip side, weakness below the $25.00 mark might continue to find decent support near the $24.65 confluence. This is closely followed by the $24.40-$24.30 strong horizontal resistance breakpoint, now turned support, which if broken decisively could drag the XAG/USD towards the $24.00 mark. The downward trajectory could get extended further towards the 38.2% Fibo. level, around the $23.75 area.
Silver 4-hour chart

Key levels to watch


Comments are closed.