WTI and Brent Rally Fails at the First Hurdle, Further Downside Ahead?
WTI PRICE, CHARTS AND ANALYSIS:
Recommended by Zain Vawda
How to Trade Oil
Most Read: Oil Price Forecast: WTI and Brent Face Challenges as Chinese Economy Remains in Focus
WTI’s resurgence failed at the first hurdle Yesterday as Oil prices faced renewed selling pressure, recording its largest drop in 2 weeks with a loss of around 3.9% on the day. This continued into the Asian session as well as the early part of European session with WTI down a further 1.8% at the time of writing trading at $68.20 a barrel.
CENTRAL BANKS REMAIN HAWKISH AMID RISING RECESSIONARY FEARS
The surprise hike by the Bank of England (BoE) yesterday coupled with the ongoing hawkish Central Bank rhetoric and bounce in the US Dollar weighing on Oil prices and overall sentiment. Market participants had been hoping for rate cuts in the second half of 2023, but many Central Banks seem destined for further rate hikes as well as maintaining policy rates at a higher level for a longer period. This has seen market participants weigh the potential impact of such a move on global growth with signs of a potential recession increasing by the day.
This morning brought a raft of PMI data from the Euro Area (READ MORE HERE) which continued its decline and weighing on overall sentiment. Given todays data another quarter of negative GDP Growth remains a possibility for the Euro Area and likely the reason behind the market reaction. The composite PMI dropped from 52.8 to 50.3 while manufacturing PMI declined from 46.4 to 44.6. Services PMI remains above the 50 mark but continues to slow, a further sign of weakness in the economy as the service sector had been the standout performer thus far. The only positive for the Euro Area lies in a busy tourist season during the summer months which could help spur some growth in the short-term at least, providing a more promising start to Q3.
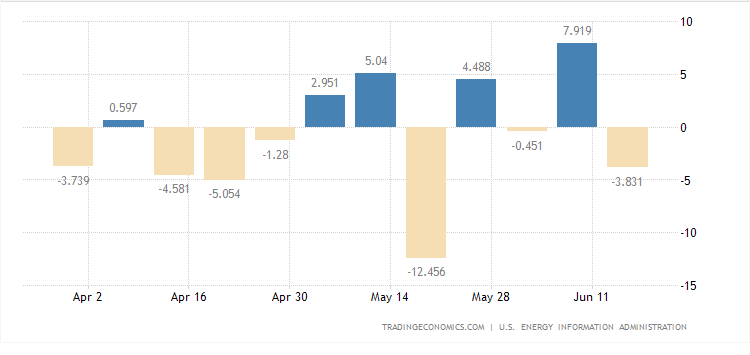
US Crude Inventories meanwhile continued their decline missing forecasts once more with a drop of 3.831 million barrels in the week ending June 16 2023, according to data from the Energy and Information Administration (EIA).
US Crude Oil Stocks Change
Source: TradingEconomics, EIA
The continuing decline in oil inventories is expected to continue globally and could prove to be a blessing in disguise for black gold moving forward. As noted by a raft of asset managers over the past week many of whom have downgraded their oil price outlook for 2023, declining inventories coupled with OPEC+ cuts could help keep oil prices supported in Q3 and Q4 of 2023.
Trade Smarter – Sign up for the DailyFX Newsletter
Receive timely and compelling market commentary from the DailyFX team
Subscribe to Newsletter
ECONOMIC CALENDAR AND EVENT RISK
Federal Reserve policymakers will be keeping market participants on their toes today ahead of the US PMI data release. Similar signs of weakness in the US economy as witnessed in the Euro Area data this morning could further weigh on Oil prices heading into the weekend.

For all market-moving economic releases and events, see the DailyFX Calendar
TECHNICAL OUTLOOK AND FINAL THOUGHTS
From a technical perspective both WTI and Brent are on course to surrender last week’s gains. The upside rally this week failing at the first key hurdle in its path the 50-day MA around the $72.68 a barrel mark.
Oil is currently testing the lower trendline of the symmetrical triangle in play and could find some short-term support. There is every chance that WTI continues to consolidate within the symmetrical triangle as the apex approaches.
Alternatively, a break and daily candle close below the symmetrical triangle could lead to a retest of the yearly lows around the $63.60 mark. However, for this to come to fruition support provided by the recent double bottom pattern around the $67.10 handle will need to be broken and could prove a tough nit to crack.
Key Levels to Keep an Eye On:
Support Levels
- $67.10
- $66.00
- $63.60 (YTD-Low)
Resistance Levels
- $70.00 (Psychological level)
- $72.68 (50-day MA)
- $74.28 (100-day MA)
WTI Crude Oil Daily Chart – June 23, 2023
Source: TradingView
IG CLIENT SENTIMENT DATA
IGCSshows retail traders are currently LONG onWTI Crude Oil, with 87% of traders currently holding LONG positions. At DailyFX we typically take a contrarian view to crowd sentiment, and the fact that traders are long suggests that WTI may enjoy a short recovery before continuing to fall.
Introduction to Technical Analysis
Technical Analysis Chart Patterns
Recommended by Zain Vawda
Written by: Zain Vawda, Market Writer for DailyFX.com
Contact and follow Zain on Twitter: @zvawda


Comments are closed.