What’s Next For EUR/USD, GBP/USD, USD/JPY?
US dollar Vs Euro, British Pound, Japanese Yen – Price Setups:
- Softening US price pressures could weigh on the US dollar.
- Upward momentum is intact as EUR/USD and GBP/USD test crucial hurdles.
- Odds growing that the recent rally in USD/JPY is corrective.
Recommended by Manish Jaradi
Get Your Free Top Trading Opportunities Forecast
Softening US price pressures could weigh on the US dollar even as the US Federal Reserve expects a recession this year as a fallout from the turmoil in the banking sector.
US CPI rose 0.1% on-month in March, down from a 0.4% increase in February, and 5.0% on-year last month compared with 6.0% in February. However, price pressures are not sufficiently weak, said Richmond Fed President Thomas Barkin, suggesting the Fed could proceed with one more hike in May. Barkin’s remarks were echoed by San Francisco Fed President Mary Daly on Wednesday that the Fed has “more work to do”.
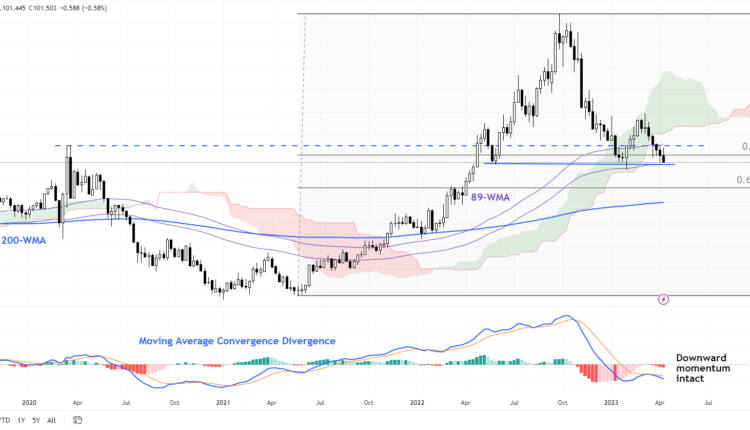
US Dollar Index (DXY Index) Weekly Chart
Chart Created Using TradingView
Furthermore, minutes from the FOMC meeting in March showed several policymakers considered pausing interest rate increases, but concluded high inflation needed to be tackled, even after a forecast from Fed staff showed that banking sector stress would tip the economy into a mild recession. Interest rate markets are pricing in about a 68% chance that the Fed will raise rates by an additional 25 basis points at its May 2-3 meeting, according to CME’s FedWatch tool.
EUR/USD Daily Chart

Chart Created Using TradingView
EUR: Flirts with key resistance at 1.10
Upward momentum is improving as EUR/USD tests a vital ceiling at the February high of 1.1035 – the ‘two-steps-forward-one-step-backward’ nature of the price action since late March is a sign of how important the resistance is. A break above the barrier could initially open the door toward the 200-week moving average (now at about 1.1200). As highlighted in the previous update, EUR/USD’s trend remains up after it in March held key support at the January low of 1.0480.
GBP/USD Daily Chart
Chart Created Using TradingView
GBP: Slowly but surely
GBP/USD is once again flirting with the December high of 1.2450. A decisive break above the resistance would trigger a breakout from the sideway channel since December. The width of the channel would point to a move toward 1.3000. As the previous update highlighted, GBP/USD’s trend remains up following the rebound in March from a crucial floor at the January low of 1.1840, coinciding with the 200-day moving average.
USD/JPY Daily Chart

Chart Created Using TradingView
USD/JPY: Struggles to extend gains
In recent days, USD/JPY has struggled to clear a tough hurdle at the April 3 high of 133.75, coinciding with the 89-day moving average and the upper edge of the Ichimoku cloud on the daily charts. Since the consolidation that began in late March, the 14-day Relative Strength Index (RSI) continues to be capped at 50-55 – corrective rebounds tend to run out of steam at 50-55 levels of the RSI. Still, a decisive cross above 133.75 would confirm that the immediate downward pressure had faded for now, raising the prospect of a broad range of 129-138.
Trade Smarter – Sign up for the DailyFX Newsletter
Receive timely and compelling market commentary from the DailyFX team
Subscribe to Newsletter
— Written by Manish Jaradi, Strategist for DailyFX.com
— Contact and follow Jaradi on Twitter: @JaradiManish


Comments are closed.