What Has Changed in USD/JPY, EUR/JPY, AUD/JPY?
US Dollar, Euro, Australian Dollar vs. Japanese Yen – Price Action:
- USD/JPY’s gains have slowed recently, but the uptrend isn’t over.
- EUR/JPY and AUD/JPY’s uptrend remains intact.
- What are the key levels to watch in select JPY crosses?
Recommended by Manish Jaradi
Top Trading Lessons
The status quo by the Bank of Japan (BOJ) at its meeting last week reasserts the prevailing weakness in the Japanese yen.
JPY surrendered some of its gains after the Bank of Japan (BOJ) kept its ultra-loose policy settings intact at its meeting on Friday, in line with expectations. For more details, see “Japanese Yen Tumbles as BOJ Maintains Status Quo: USD/JPY Eyes 150,” published September 22.
BOJ’s persistent ultra-easy monetary policy diverges from its peers where central banks remain hawkish. Moreover, the broader growth outlook has converged, leaving little relative growth advantage to trigger a material appreciation in JPY. This suggests that unless the global central bank takes a step back from the hawkishness and/or BOJ steps up its hawkishness, the path of least resistance for the yen remains sideways to down. See “Japanese Yen’s Slide Pauses but for How Long? USD/JPY, EUR/JPY, MXN/JPY Price Setups,” published September 4.
In this regard, the key focus is on whether Japanese authorities intervene – USD/JPY is now in the band that triggered intervention in 2022. Skeptics argue that unless some of the currency drivers shift in favor of the yen, intervention could stall the bearish trend of the Japanese currency but may not be enough to reverse the course.
USD/JPY 240-Minute Chart
Chart Created by Manish Jaradi Using TradingView
Recommended by Manish Jaradi
Improve your trading with IG Client Sentiment Data
USD/JPY: Upward momentum has slowed
On technical charts, USD/JPY appears to be struggling to extend gains. Despite that, USD/JPY continues to hold above vital support levels. For instance, on the 240-minute charts, USD/JPY has been trending above the 200-period moving average since July. A break below the moving average, which coincides with the mid-September low of 146.00 would be a warning sign that the two-month-long uptrend was changing. A fall below the early-September low of 144.50 would put the bullish bias at risk. On the upside, USD/JPY is approaching a stiff ceiling at the 2022 high of 152.00. Above 152.00, the next level to watch would be the 1990 high of 160.35.
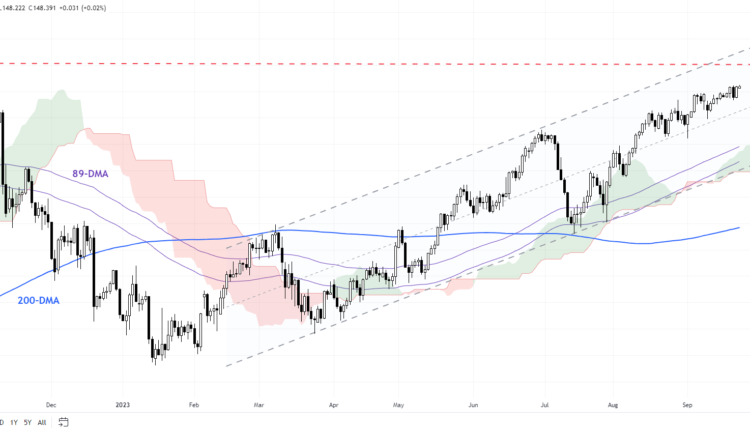
EUR/JPY Daily Chart

Chart Created by Manish Jaradi Using TradingView
EUR/JPY: Rally stalls, but isn’t over
EUR/JPY rally has stalled in recent weeks. However, the evidence suggests the broader uptrend remains unaffected despite the consolidation for two reasons: the cross continues to hold above the Ichimoku cloud on the daily chart and the 89-day moving average, signaling that the trend remains up. Also, the cross hasn’t decisively broken any vital pivot support, including the June high and the late-August low (around 156.50-158.00).
AUD/JPY Daily Chart
Chart Created by Manish Jaradi Using TradingView
AUD/JPY: Beginning to flex muscles
AUD/JPY’s break last week above a minor resistance on a horizontal trendline since August that came at 95.00 confirms that the immediate downward pressure has faded. This follows a rebound from strong converged support, including the 89-day moving average, the February high, and the lower edge of the Ichimoku cloud on the daily charts. Zooming out, despite the weakness since June, the cross continues to hold within a rising pitchfork channel since the end of 2022. Any break above the initial resistance at the July high of 95.85 could pave the way toward the June high of 97.70.
Recommended by Manish Jaradi
Traits of Successful Traders


Comments are closed.