USD/JPY on Breakout Quest as GBP/JPY Fends Off Support Test
Trade Smarter – Sign up for the DailyFX Newsletter
Receive timely and compelling market commentary from the DailyFX team
Subscribe to Newsletter
USD/JPY TECHNICAL ANALYSIS
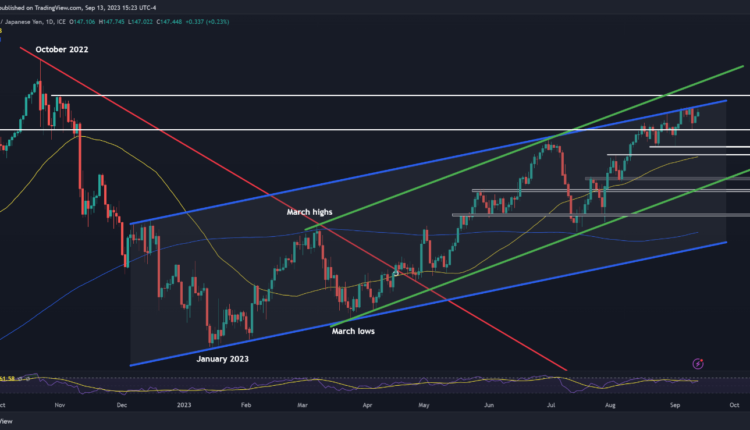
USD/JPY advanced last week to its highest level since November 2022, but pulled back after a failed attempt to clear channel resistance, which coincided with comments from Bank of Japan Governor Ueda indicating that the monetary authority may be in a better position to move away from negative interest rates by year’s end.
Although the yen initially responded positively to these developments, its strength was short-lived. The daily chart below shows how USD/JPY has quickly resumed its upward trajectory in place since early 2023, a clear sign that the bulls are still in control of the market and may soon find the impetus to trigger a bullish breakout.
Looking ahead to the next potential leg higher, initial resistance lies near the psychological 148.00 level. However, a push beyond this technical barrier could lure new buyers into the market, creating the right conditions for an acceleration towards 148.80, followed by 150.00, the upper limit of rising channel in play since early March. On further strength, we could see a move towards 152.00.
In the event of a setback and subsequent weakness, technical support can be found at 145.90, and 144.55 thereafter. It's conceivable that the price may establish a base in this range during a pullback, but in case of a breakdown, all bets are off as such a move could open the door for a retracement towards 143.85 ahead of a slide toward 141.75.
Stay informed and enhance your trading strategy. Download the yen forecast today to discover the risk events that could influence the market!
Recommended by Diego Colman
Get Your Free JPY Forecast
USD/JPY TECHNICAL CHART
USD/JPY Chart Created Using TradingView
GBP/JPY TECHNIAL ANALYSIS
Starting in late July and continuing into August, GBP/JPY embarked on a robust uptrend. However, this upward momentum faltered following a failed attempt at breaching overhead resistance in the 186.75 area, with prices retreating since that rejection, guided lower by a short-term dynamic trendline. As of this update, the pair is sitting above a key floor stretching from 183.60 to 183.10.
In the event that the 183.60/183.10 technical support range fails to hold, selling momentum could intensify, setting the stage for a drop towards the psychological 180.00 mark. While this region may act as an initial shield against further declines, a breakdown could bring the 176.35 level into view. On further weakness, sellers could make a move on 174.73, the 38.2% Fib retracement of the 2023 rally.
Alternatively, if buyers reassert their influence and propel prices decisively higher, trendline resistance is positioned at 185.35. Successfully piloting above this ceiling could reinforce upward impetus, emboldening the bulls to mount an offensive against the 2023 highs.
Master GBP/JPY price dynamics with our sentiment guide. Get it free today!
| Change in | Longs | Shorts | OI |
| Daily | -10% | 6% | 1% |
| Weekly | -6% | 1% | -1% |
GBP/JPY TECHNICAL CHART

GBP/JPY Chart Prepared Using TradingView


Comments are closed.