USD/JPY Loses Altitude and Sinks to Support, AUD/USD Defies Ironclad Resistance
Recommended by Diego Colman
Get Your Free JPY Forecast
USD/JPY TECHNICAL ANALYSIS
USD/JPY posted heavy losses on Thursday, down about 0.5% in afternoon trading, one day after the Federal Reserve flagged a possible rate hike pause following 500 basis points of cumulative tightening since March 2022. Risk aversion also appeared to benefit the Japanese yen, with the U.S. equity market underwater, dragged lower by banking sector woes and fears that more regional banks will bite the dust soon.
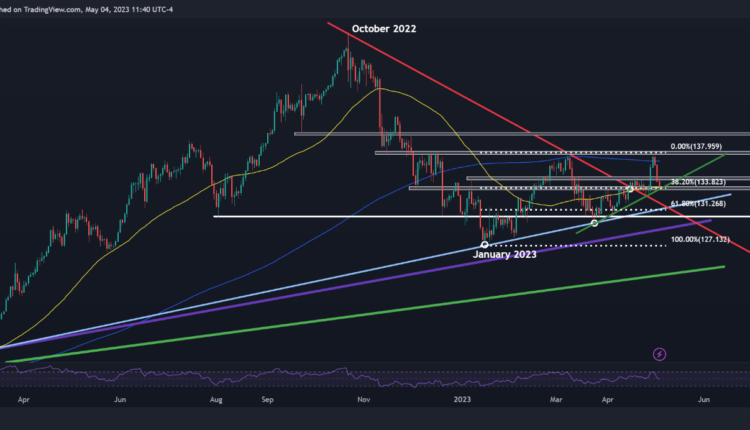
In terms of technical analysis, USD/JPY has pulled back significantly after a failed attempt to recapture its 2023 highs established in March. As the chart below shows, sellers effectively repelled bulls from the 137.95 area, setting the stage for a precipitous decline over the past three days.
With bears back in control of the market, the pair has moved closer to confluence support at 134.00/133.75, where the 50-day simple moving average aligns with a short-term rising trendline and the 38.2% Fibonacci retracement of the January-March rally. To hope for a resumption of the recent uptrend, this floor must hold, otherwise a bigger retrenchment toward 131.70 could be in the cards.
In case of a bullish reversal off of current levels, initial resistance lies near the psychological 135.00 round-figure mark. A sustained move above this technical barrier is needed to revive positive momentum and have a standing chance of recapturing the 200-day simple moving average in the near term.
USD/JPY TECHNICAL CHART
USD/JPY Chart Prepared Using TradingView
Recommended by Diego Colman
Get Your Free AUD Forecast
AUD/USD TECHNICAL ANALYSIS
The Australian dollar was unable to capitalize on the Federal Reserve's decision to signal strongly that its benchmark rate has reached a cycle peak. Although AUD/USD managed to eke out a gain on Thursday, its advance was modest, as the bearish mood linked to the U.S. regional banks' upheaval dented the appetite for riskier currencies, preventing a more meaningful appreciation.
If volatility increases in response to ongoing banking sector developments in the U.S., the Australian dollar will have a hard time outperforming its American counterpart given its high sensitivity to underlying risk trends and global sentiment. For this reason, it is very important to keep an eye on market headlines coming out of the U.S.
From a technical standpoint, AUD/USD is at a critical juncture, with the pair testing cluster resistance, stretching from 0.6700 to 0.6740, where two major trendlines converge with the 200-day simple moving average and the 38.2% Fibonacci retracement of the 2022 selloff.
The battle between bulls and bears should be fierce in the 0.6700/0.6740 region, but if the former overpowers the latter and triggers a breakout, the broader trading bias will turn more constructive for the Aussie, paving the way for a possible climb toward 0.6800, followed by 0.6890.
Alternatively, if prices get rejected from technical resistance and resume their descent, initial support rests at 0.6580. Buyers should defend this floor at all costs, otherwise a deeper pullback toward 0.6515 can get underway in short order.
AUD/USD TECHNICAL CHART

AUD/USD Chart Prepared Using TradingView


Comments are closed.