USD/JPY Latest – Japanese Yen Fight Back Thwarted by Rising US Bond Yields
Japanese Yen USD/JPY Prices, Charts, and Analysis
- US ADP data sends US bond yields sharply higher.
- Will the MoF act to prop up the Yen?
Recommended by Nick Cawley
Download our Brand New Q3 JPY Guide
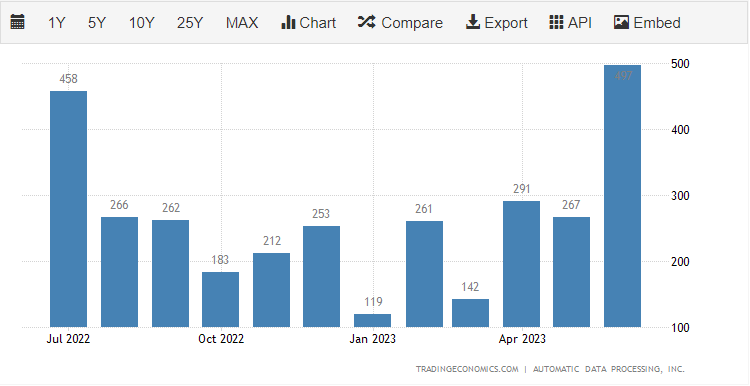
The latest FOMC minutes suggest that while further monetary tightening is likely, it will be conducted at a slower pace and be increasingly data-dependent. One area of data that the Fed will be keeping a close eye on is the labor market, and there is a lot of job data out over the next 48 hours, culminating with the latest NFP release on Friday. This will need to be watched closely after the recently released US ADP report showed a huge surge with private businesses creating nearly half-a-million new jobs in June, well above the forecast of 228k and May’s reading of 267K.
A probable 25 basis point hike at the July 26 meeting has already been priced-in to the US dollar and further strength in the US jobs market, one of the main drivers of inflation, may prompt the Federal Reserve to raise rates even further. US bond yields jumped post-ADP with the US Treasury 2-year back above 5%.
US Treasury 2-Year Yield

Recommended by Nick Cawley
How to Trade USD/JPY
The Japanese Yen has been in favor today as global markets turn risk-off post-FOMC. The Yen’s haven role remains, despite the currency’s weakness over the last few months and fears that higher for longer US interest rates may depress equity markets around the globe.
The Japanese currency is also turning higher as traders listen to ongoing commentary from Japanese officials that the Yen has weakened too far and too fast. USD/JPY is nearing levels that prompted the MoF to begin propping up the currency and traders are worried that the latest round of verbal intervention is a prelude to intervention in the foreign exchange market.
The daily USD/JPY is showing signs of topping out over the last week and this may continue in the coming days. While the overall technical outlook of the chart remains positive, a market that is being very closely watched by a central bank is a difficult market to make anything more than a very short-term trade in.
USD/JPY Daily Price Chart – July 6, 2023
| Change in | Longs | Shorts | OI |
| Daily | 28% | -16% | -5% |
| Weekly | 20% | -16% | -6% |
Retail Sentiment is Net-Short
Retail trader data shows 26.74% of traders are net-long with the ratio of traders short to long at 2.74 to 1.The number of traders net-long is 0.15% lower than yesterday and 3.28% lower from last week, while the number of traders net-short is 1.55% lower than yesterday and 1.02% higher from last week.
We typically take a contrarian view to crowd sentiment, and the fact traders are net-short suggests USD/JPY prices may continue to rise. Positioning is less net-short than yesterday but more net-short from last week. The combination of current sentiment and recent changes gives us a further mixed USD/JPY trading bias.
What is your view on the Japanese Yen – bullish or bearish?? You can let us know via the form at the end of this piece or you can contact the author via Twitter @nickcawley1.


Comments are closed.