USD Index regains traction and targets the 105.00 region
- The index leaves behind part of Wednesday’s marked pullback.
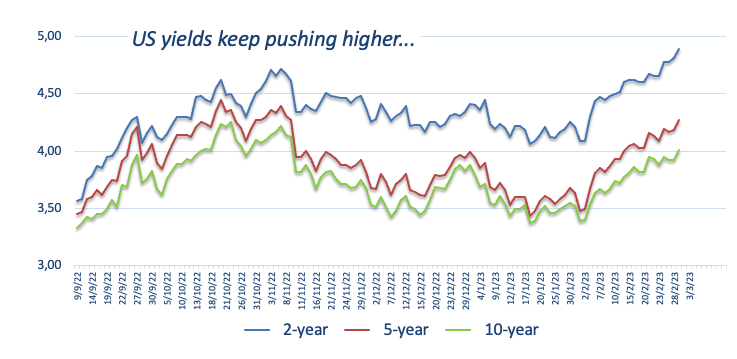
- US 2-year yields approach the key 5% level, nearly 6-year tops.
- Weekly Claims, FOMC Waller take centre stage later in the US docket.
The greenback, in terms of the USD Index (DXY), manages to regain some balance and advances to the 104.80 region on Thursday.
USD Index looks to yields, data
The index keeps the choppy performance well in place so far this week and now looks to revisit the 105.00 neighbourhood on the back of the knee-jerk in the risk-associated universe and the unabated march north in US yields.
On the latter the short end of the curve gradually approaches the key 5% threshold for the first time since early July 2007 along with persistent hawkish Fedspeak and dwindling probability of a 25 bps rate hike at the Fed’s March 22 gathering.
In the docket, weekly Initial Claims will be in the limelight seconded by the speech by FOMC C.Waller.
What to look for around USD
The index regains traction after Wednesday’s strong drops to the vicinity of the 104.00 region.
The probable pivot/impasse in the Fed’s normalization process narrative is expected to remain in the centre of the debate along with the hawkish message from Fed speakers, all after US inflation figures for the month of January showed consumer prices are still elevated, the labour market remains tight and the economy maintains its resilience.
The loss of traction in wage inflation – as per the latest US jobs report – however, seems to lend some support to the view that the Fed’s tightening cycle have started to impact on the still robust US labour markets somewhat.
Key events in the US this week: Initial Jobless Claims (Thursday) – Final Services PMI, ISM Non-Manufacturing (Friday).
Eminent issues on the back boiler: Rising conviction of a soft landing of the US economy. Persistent narrative for a Fed’s tighter-for-longer stance. Terminal rates near 5.5%? Fed’s pivot. Geopolitical effervescence vs. Russia and China. US-China trade conflict.
USD Index relevant levels
Now, the index is gaining 0.36% at 104.75 and faces the next resistance at 105.35 (monthly high February 27) seconded by 105.63 (2023 high January 6) and then 106.52 (200-day SMA). On the downside, the breakdown of 103.45 (55-day SMA) would open the door to 102.58 (weekly low February 14) and finally 100.82 (2023 low February 2).


Comments are closed.