USD/CHF consolidates gains at the 0.8845 area, bulls need a catalyst
- USD/CHF trades at the 0.8845 zone with mild losses.
- The bulls are having a hard time consolidating above 0.8850.
- 20-day SMA en route to perform a bullish cross with the 100-day SMA.
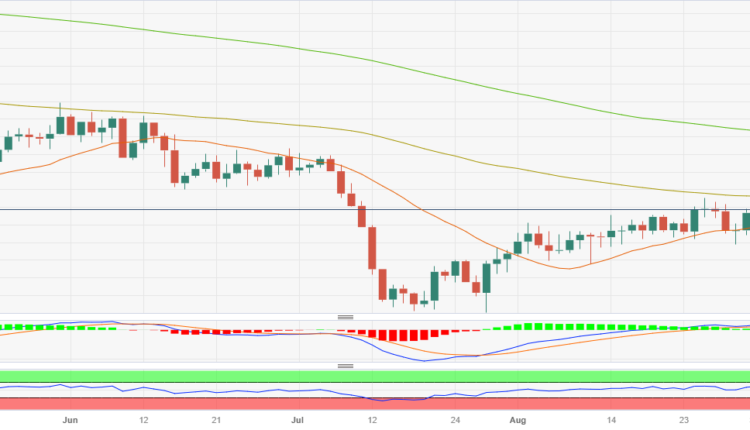
The USD/CHF has traded sideways since early August in the 0.8700 – 0.88450 range, with bulls failing to gather momentum and seeming to await fresh catalysts.
According to the daily chart, the technical outlook for the USD/CHF remains neutral. The Relative Strength Index (RSI) indicates a stagnant bullish momentum with a flat slope above its midline, while the Moving Average Convergence (MACD) prints unchanged green bars. The four-hour chart also shows a clear neutral bias with no clear dominance and indicators having turned flat.
On the bigger picture, the pair is above the 20-day Simple Moving Average (SMA) but below the 100 and 200-day SMAs, suggesting that despite the recent bearish sentiment, the bulls are still resilient, holding some momentum but that for the longer term, the bears have the upperhand. Traders should eye the convergence of the 20 and 100-day SMA towards the 0.8850 – 0.8880 range as they are about to perform a bullish cross. It's worth mentioning that when a shorter-term SMA crosses above a longer-term SMA, it's usually considered bullish for the pair in the short term.
For this week, a fundamental catalyst is the release of the ISM Services PMI from the US which could influence the bets of the markets on the next Federal Reserve (Fed) decisions and, hence, the USD price dynamics.
Support levels: 0.8800 (20-day SMA), 0.8750, 0.8700.
Resistance levels: 0.8850, 0.8880 (100-day SMA), 0.8900.
USD/CHF Daily Chart
-638294568139617630.png)


Comments are closed.