USD/CAD Price Seeks Breakout Ahead of Canadian GDP
USD/CAD ANALYSIS & TALKING POINTS
- USD strength has been limiting CAD upside but could be fading.
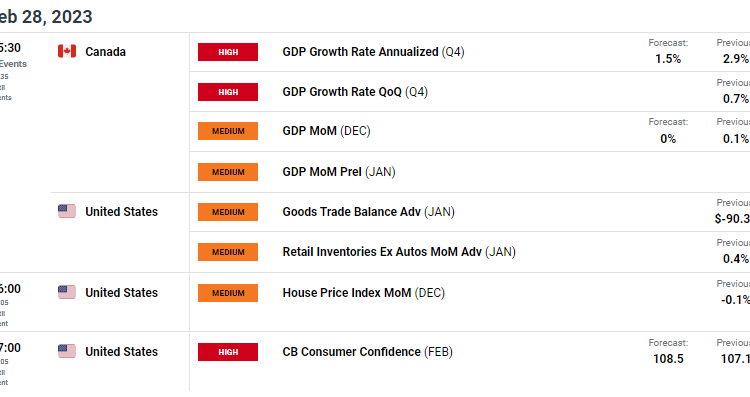
- Canadian GDP and US consumer confidence in focus later today.
- Rising wedge formation could suggest looming CAD strength.
Recommended by Warren Venketas
Get Your Free USD Forecast
USD/CAD FUNDAMENTAL BACKDROP
The Canadian dollar has been at the mercy of USD dictatorship of recent as the markets continue its hawkish repricing of interest rate guidance for the Federal Reserve. Peak rates for 2023 have now pushed up above 5.4% while money markets forecast no change in the Bank of Canada (BoC)‘s upcoming rate decision. This central bank divergence could weigh negatively on the loonie; however, Fed tightening is very much baked into current pricing and only additional positive US economic data could spur the greenback on even further. Fed officials continue to add to the aggressive monetary policy narrative but this has been the case for some weeks now and markets seem to be reacting lesser to their guidance.
Trade Smarter – Sign up for the DailyFX Newsletter
Receive timely and compelling market commentary from the DailyFX team
Subscribe to Newsletter
Later today, Canadian GDP (see economic calendar below) is expected to come in lower with the QoQ figure anticipated to be negative. This could heighten recessionary fears in Canada as the first quarter of contractionary growth since Q2 2021. From a US perspective, consumer confidence for February is estimated to come in higher than January and if both sets of data release as expected, the CAD could lose further ground to the USD.
USD/CAD ECONOMIC CALENDAR
Source: DailyFX Economic Calendar
TECHNICAL ANALYSIS
Introduction to Technical Analysis
Candlestick Patterns
Recommended by Warren Venketas
USD/CAD DAILY CHART

Chart prepared by Warren Venketas, IG
USD/CAD price action stays withing the developing rising wedge chart pattern (black) and testing the 1.3600 psychological level. Considering the falling wedge pattern, I would naturally be looking for a push lower confirmed by a break and candle close below wedge support which could expose the 1.3500 handle once more. The Relative Strength Index (RSI) level is nearing overbought territory which could be in support of an impending downside move.
Key resistance levels:
Key support levels:
- 1.3500
- 50-day SMA (yellow)
IG CLIENT SENTIMENT DATA POINTS TO SHORT-TERM DOWNSIDE
IGCS shows retail traders are currently prominently SHORT on USD/CAD , with 58% of traders currently holding short positions (as of this writing). At DailyFX we typically take a contrarian view to crowd sentiment but after recent changes in longs and shorts, sentiment reveals a BEARISH disposition.
Contact and followWarrenon Twitter:@WVenketas


Comments are closed.