USD/CAD Eyes Fib Resistance as Bulls Regain Upper Hand
USD/CAD TECHNICAL FORECAST:
- USD/CAD begins the week on a positive note, though gains are limited
- Despite subdued price action on Monday, technical signals continue to improve for the U.S. dollar
- This article looks at key tech levels worth watching on USD/CAD in the coming days
Recommended by Diego Colman
Get Your Free USD Forecast
Most Read: Gold Gains as Yields Sink, Nasdaq 100 Forges Double Top ahead of Key Tech Earnings
The U.S. dollar strengthened against the Canadian dollar on Monday, but its advance was limited in a session devoid of major catalysts, with the pair moving between small gains and losses for much of the day, before resolving modestly higher towards the close in New York. When it was all said and done, USD/CAD climbed 0.05% to 1.3540, rising for the last six of the previous seven days, a sign that buyers may have regained the upper hand in the FX space.
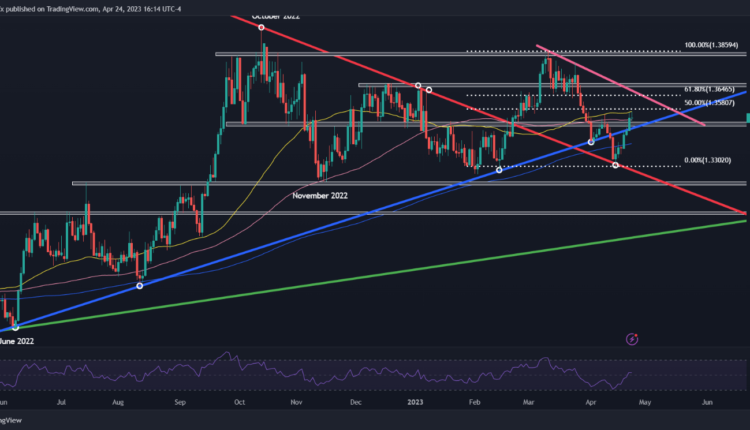
Despite subdued moves at the start of the week, technical signals have turned more positive for USD/CAD, especially since earlier this month when the bulls successfully defended trendline support at 1.3300, an event that led to a strong rally. The trading bias has further improved in recent days after the exchange rate regained its 200-day simple moving average and moved atop a key ascending trendline in play for 10 months.
Related: US Dollar (DXY) Little Changed Ahead of Weighty Economic Data
With bullish inertia on its side, USD/CAD could extend its recovery in the coming days and defy resistance at 1.3570/1.3580, an area where the 50-day simple moving average converges with the 50% Fibonacci retracement of the March/April slump. The pair may struggle to breach this barrier, but if a breakout materializes, a rally toward trendline resistance at 1.3650 could follow.
On the other hand, if sellers return and trigger a pullback, initial support stretches from 1.3515 to 1.3485. A decisive break below this floor could embolden bears to launch an attack on the 200-day simple moving average, located slightly above the psychological 1.3400 mark. In the event of additional weakness, attention would shift south towards this year's low at 1.3302.
| Change in | Longs | Shorts | OI |
| Daily | 5% | 19% | 14% |
| Weekly | -36% | 114% | 18% |
USD/CAD TECHNICAL CHART
USD/CAD Chart Prepared Using TradingView


Comments are closed.