US Treasury Yields Price Action: Rally is Looking Tired
US Treasury yields, US dollar, USD – Outlook:
- US Treasury yields’ rally is showing signs of fatigue.
- Yields are testing major resistance ahead of key US economic data.
- What is the outlook and what are the key signposts to watch?
Recommended by Manish Jaradi
Traits of Successful Traders
The recent rally in US Treasury yields is showing signs of fatigue ahead of key US economic data.
Stronger-than-expected US data this month – the Economic Surprise Index is at its highest level since April — has led to a dramatic repricing higher in Fed rate hike expectations on the growing ‘higher-for-longer’ rates view. Rate futures are now pricing in the Fed’s target rate to peak around 5.42% in September from the current 4.50-4.75%, compared with under 5% at the end of January.
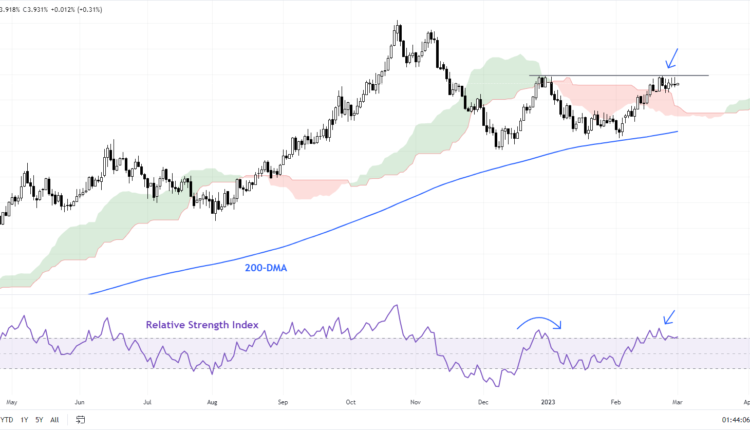
US Treasury 30-year yield Daily Chart
Chart Created Using TradingView
Despite the most recent beats in US data, especially Friday’s PCE price index data, yields failed to break past key resistance zones. Moreover, recent comments by Fed officials, though hawkish, hasn’t tilted toward last year's jumbo rate hikes, suggesting that for now, policymakers prefer to stick with the current gradual tightening trajectory as the impact of previous hikes spills over the economy.
US Treasury 10-year yield Daily Chart

Chart Created Using TradingView
While the broader trajectory remains up, most recently Treasury yields also seem to be in a wait-and-watch mode – the back-to-back small candlesticks/ doji patterns in recent days on the yield charts suggests the market is looking for further cues – from data or further Fed guidance on rates.
US Treasury 10-year yield 240-minute Chart
Chart Created Using TradingView
In this regard, the key focus is now on US ISM Manufacturing and Services PMI data due later today and Friday respectively. US Fed Chair Powell is due to speak tomorrow and Friday at the semi-annual testimony. In his remarks following the upbeat jobs data in early February, he maintained the ‘disinflation’ emphasis and didn’t tilt toward the aggressive side.
US Treasury 2-year yield Weekly Chart

Chart Created Using TradingView
The US Treasury 2-year yield chart is testing a major barrier at the November high of 4.88%. Negative divergence on the weekly charts – higher yields associated with a declining 14-week Relative Strength Index – suggests the yield rally is looking tired. On the daily charts, the yield’s fall at the end of last year below the key price pivot at the end-October low of 4.27% could be a sign that the yield rally is beginning to crack, at least in the interim.
US Treasury 2-year yield Daily Chart
Chart Created Using TradingView
The US Treasury 10-year yield and the 30-year yield are flirting with key hurdles at their respective January highs. To be fair, the stalling of the price action could imply a pause before the next leg higher in yields. However, in the absence of a strong bullish (higher yields) catalyst, the path of least resistance appears to be sideways to down. The 10-year yield has a vital cushion at Friday’s low of 3.85% (see 240-minute chart). Any break below would confirm that this month’s upward pressure in yields had faded.
Trade Smarter – Sign up for the DailyFX Newsletter
Receive timely and compelling market commentary from the DailyFX team
Subscribe to Newsletter
— Written by Manish Jaradi, Strategist for DailyFX.com


Comments are closed.