US Dollar Strength Weighs on EUR/USD, Euro Area PMIs Near
EUR/USD Prices, Charts, and Analysis
- US debt ceiling talks continue as default deadline day nears.
- US dollar technical outlook remains positive despite Friday’s sell-off.
Recommended by Nick Cawley
Get Your Free EUR Forecast
Debt Ceiling Blues, Part 79. What Happens if the US Defaults?
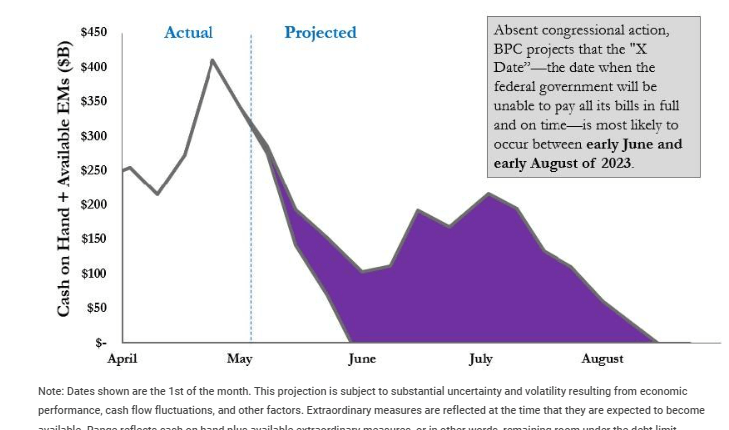
US debt ceiling talks continue tomorrow with President Joe Biden meeting House Speaker Kevin McCarthy with Treasury Secretary Janet Yellen warning that the US government could run out of money soon, ringing in their ears. Ms. Yellen says the so-called ‘X-date’, when the US Government is unable to pay its bills in full and/or on time’, is June 1st although the closely followed Bipartisan Policy Organisation sees a more flexible early-June to early-August deadline depending on cash inflows.
The US dollar is being buoyed by these debt default fears with investors in ultra-short, one-month US Treasury bills demanding higher yields over the potential X-date. The yield on the one-month bill hit a multi-decade high of 5.90% last Tuesday and is currently trading at a still elevated 5.54%.
US One Month Bill Yield – Monthly Chart

While the market concentrates on the US debt talks, the Euro will likely be more volatile on Tuesday with the release of the latest PMI reports. These flash PMIs ‘are based on the evaluation of 75% to 85% of the survey responses and provide an initial, timely assessment of the economic trend’ according to new data sponsor Hamburg Commercial Bank (HCOB).
For all market-moving events and economic data releases, see the real-time DailyFX Calendar
After printing a fresh one-year high of 1.1095 in late April, EUR/USD has tested, and rejected, this level a couple of times in May. Since the start of May, the pair have moved steadily lower, breaking below 1.0800 at the end of last week on renewed US dollar strength. The move lower has seen EUR/USD drop below both the 20- and 50-day moving average, a negative set-up, while the pair have made a near-unbroken set of lower highs and lower lows this month.
EUR/USD Daily Price Chart – May 22, 2023
Chart via TradingView
| Change in | Longs | Shorts | OI |
| Daily | 6% | 13% | 9% |
| Weekly | -6% | 7% | -1% |
Retail Trading Suggests Potential Upside for EUR/USD
Retail trader data shows 56.21% of traders are net-long with the ratio of traders long to short at 1.28 to 1.The number of traders net-long is 2.79% higher than yesterday and 8.83% lower from last week, while the number of traders net-short is 6.30% higher than yesterday and 6.69% higher from last week.
We typically take a contrarian view to crowd sentiment, and the fact traders are net-long suggests EUR/USD prices may continue to fall. Yet traders are less net-long than yesterday and compared with last week. Recent changes in sentiment warn that the current EUR/USD price trend may soon reverse higher despite the fact traders remain net-long.
What is your view on the EURO – bullish or bearish?? You can let us know via the form at the end of this piece or you can contact the author via Twitter @nickcawley1.


Comments are closed.