US Dollar Soars Lifted by Surging Yields, S&P 500 Falls Despite VIX’s Slide
US DOLLAR & EQUITY MARKET OUTLOOK:
- The U.S. dollar jumps as Treasury yields rally on hotter-than-expected labor market data
- U.S. stocks slide despite the pullback in the VIX index
- Key technical levels to watch on the S&P 500 and DXY index
Recommended by Diego Colman
Get Your Free USD Forecast
Most Read: Gold Price at Risk of Selloff With the 2-Year Treasury Yield Nearing 5%
After a sharp pullback on Wednesday, the U.S. dollar, as measured by the DXY index, resumed its recovery on Thursday driven by a surge in Treasury rates. The S&P 500, in contrast, traded lower, even in the face of a retrenchment of the VIX index, also known as the Wall Street fear gauge.
Bond yields, already advancing during the European session, accelerated higher after data related to the U.S. labor market surprised to the upside, paving the way for the 10-year note to hit 4.08%, its highest level since November 2022.
By way of context, unit labor costs grew more than expected during the last three months of 2022, rising 3.2% on an annualized basis, twice above consensus estimates. This result suggests that wage pressures will remain elevated for the foreseeable future, reinforcing inflationary forces in the economy, a scenario that could complicate the Federal Reserve's efforts to restore price stability.
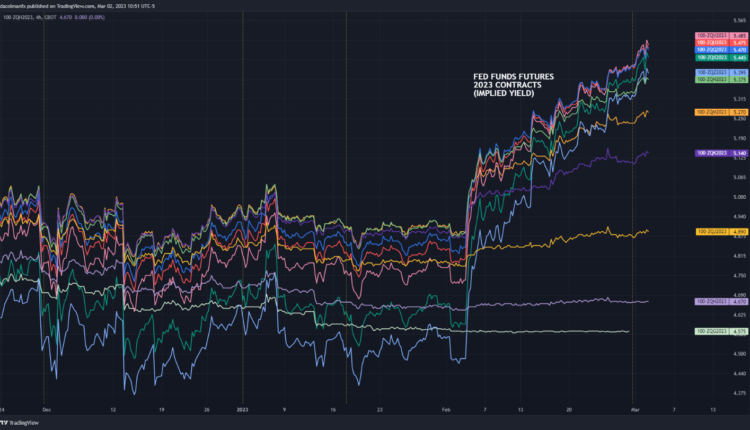
Labor market tightness, coupled with sticky inflation, has increased the risk that the FOMC will continue to tighten into the summer, indefinitely delaying a dovish pivot. Expectations already reflect this assessment, with Fed funds futures discounting a terminal rate of approximately 5.5%, up from 4.90% in early February. This implies just over three additional 25 basis point hikes.
2023 FED FUNDS FUTURES IMPLIED YIELDS
The hawkish repricing of the Fed’s monetary policy outlook, while positive for the U.S. dollar, has been undermining stocks lately, bringing the 2023’s Wall Street rally to a screeching halt. Against this backdrop, both the S&P 500 and the Nasdaq 100 have retreated sharply from their February highs, but remain far from their yearly lows. That trough, however, could be retested soon if bond yields hasten their advance over the coming days and weeks.
Higher borrowing costs, in addition to depressing consumer demand, weigh on equity valuations by increasing the discount rate used to calculate the present value of a company's future cash flows. The effect is especially negative for technology and growth stocks, which often do not yet have solid earnings.
Recommended by Diego Colman
Get Your Free Equities Forecast
S&P 500 TECHNICAL ANALYSIS
After its recent slump, the S&P 500 is sitting above cluster support, near the 3,940 area, where the 200-day simple moving average converges with a long-term descending trendline. If sellers manage to push the index below this floor, we could see a move towards 3,885. On further weakness, the focus shifts to 3,765, December’s low.
On the flip side, if the S&P 500 rebounds from current levels, initial resistance appears around the psychological 4,000 level. If this ceiling is taken out, bulls could launch an attack on 4,035, followed by 4,100.
S&P 500 TECHNICAL CHART

S&P 500 Chart Prepared Using TradingView
| Change in | Longs | Shorts | OI |
| Daily | 3% | 1% | 2% |
| Weekly | 6% | 3% | 5% |
US DOLLAR (DXY) TECHNICAL ANALYSIS
The U.S. dollar index has resumed its ascent after bouncing off a short-term ascending trendline. If the index continues to recover, the first ceiling to consider appears near the 2023 highs, but if prices clear this barrier, a move towards Fibonacci resistance at 106.18 cannot be ruled out. In contrast, if sellers resurface and trigger a bearish reversal, support rests at 104.30, followed by 103.70.
US DOLLAR TECHNICAL CHART
US Dollar (DXY) Technical Chart Prepared Using TradingView
Written by Diego Colman, Contributing Strategist for DailyFX


Comments are closed.