US Dollar Showing Tentative Signs of Fatigue: EUR/USD, GBP/USD, USD/JPY
US Dollar Vs Euro, British Pound, Japanese Yen – Price Setups:
Recommended by Manish Jaradi
Get Your Free Top Trading Opportunities Forecast
Developments on the technical charts indicate that the US dollar’s rally is beginning to show tentative signs of fatigue, pointing to a minor pause in the near term. However, there are no signs of reversal yet, suggesting that it would be premature to conclude that the uptrend is over.
DXY Index: Upward pressure could be easing a bit
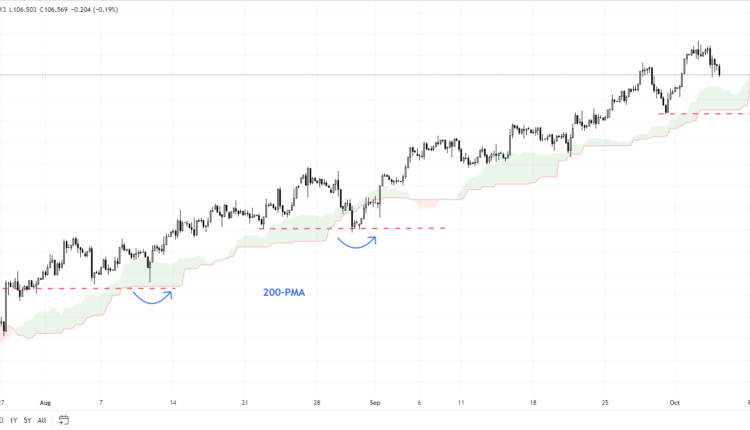
The DXY Index’s (US dollar index) fall below minor support at last week’s high of 106.85 indicates that the upward pressure has faded a bit. However, this wouldn’t imply that the uptrend is reversing – indeed, the index would need to break below quite strong support at Friday’s low of 105.65, coinciding with the lower edge of the Ichimoku cloud on the 240-minute charts.
DXY Index (USD index) 240-minute Chart
Chart Created by Manish Jaradi Using TradingView
As the accompanying chart shows, on previous occasions, the index has rebounded from similar support, so it wouldn’t be surprising if it does so again. Only a break below the 200-period moving average (now at 105.00) on the 240-minute chart would pose a threat to the broader uptrend.
EUR/USD Weekly Chart

Chart Created by Manish Jaradi Using TradingView
EUR/USD: Upward channel breaks
EUR/USD’s fall below the May low of 1.0635 is a sign that the broader upward pressure has faded. This coincides with a crack below the lower edge of a rising channel from early 2023. The pair is looking deeply oversold as it tests another vital floor at the January low of 1.0480, not too far from the lower edge of the Ichimoku cloud on the weekly charts (at about 1.0315). A break below 1.0315-1.0515 would pose a severe risk to the uptrend that began in late 2022. Plenty of resistance on the upside to cap corrective rallies, including 1.0650, 1.0735, and 1.0825.
GBP/USD Weekly Chart
Chart Created by Manish Jaradi Using TradingView
GBPUSD: Weak bias as it approaches support
GBP/USD’s break below support at the May low of 1.2300 has opened the way toward a major cushion at the March low of 1.1800, around the lower edge of the Ichimoku cloud on the weekly charts (at about 1.1600). A fall below 1.1600-1.1800 would pose a risk to the broader recovery, disrupting the higher-top-higher-bottom sequence since late 2022.
USD/JPY Daily Chart

Chart Created by Manish Jaradi Using TradingView
USD/JPY: Sharp retreat from a tough hurdle
USD/JPY has retreated from the psychological barrier at 150, not too far from the 2022 high of 152.00. The bearish reversal created this week could be early signs of fatigue in the rally. However, unless USD/JPY falls under support at Tuesday’s low of 147.25, coinciding with the 200-period moving average on the 240-minute chart, along with the lower edge of a rising channel since September, the path of least resistance remains sideways to up. Any break below 147.00-147.25 could open the way toward the early-September low of 144.50.
Recommended by Manish Jaradi
Top Trading Lessons
— Written by Manish Jaradi, Strategist for DailyFX.com
— Contact and follow Jaradi on Twitter: @JaradiManish


Comments are closed.