US Dollar Gets a Boost from Optimistic Fed; EUR/USD, GBP/USD, AUD/USD
US Dollar Vs Euro, British Pound, Australian Dollar – Price Setups:
- USD boosted by higher for longer Fed rates after hawkish FOMC projections.
- EUR/USD and GBP/USD are testing quite strong support; AUD/USD has retreated from key resistance.
- What’s next for EUR/USD, GBP/USD, and AUD/USD?
Recommended by Manish Jaradi
New to FX? Try this link for an introduction!
The US dollar received a boost overnight after the US Federal Reserve signaled one more rate hike before the end of the year and fewer rate cuts than previously indicated. The Fed kept the fed funds rate unchanged at 5.25%-5.5%, in line with expectations while lifting the economic assessment to ‘solid’ from ‘moderate’ and leaving the door open for one more rate hike as ‘inflation remains elevated’.
The Summary of Economic Projections showed 50 basis points fewer rate cuts in 2024 than the projections released in June. The Committee now sees just two rate cuts in 2024 which would put the funds rate around 5.1%. With the US economy outperforming some of its peers, the path of least resistance for the greenback remains sideways to up.
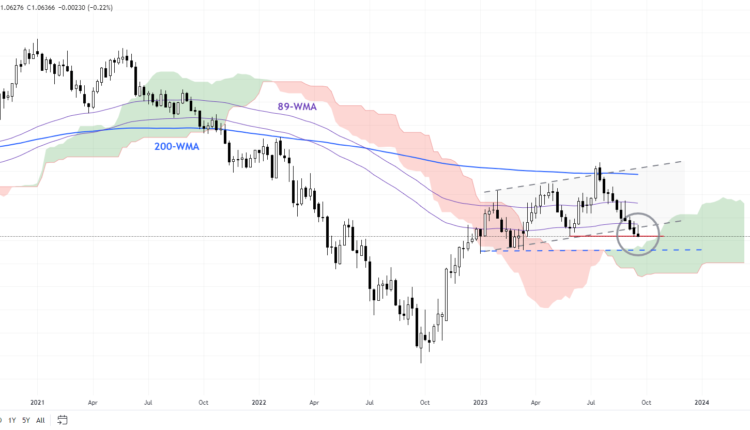
EUR/USD Weekly Chart
Chart Created by Manish Jaradi Using TradingView
EUR/USD: No confirmation of a low
EUR/USD is testing fairly strong support at the May low of 1.0630. Oversold conditions suggest it could be tough to break below at least in the first attempt. But unless EUR/USD is able to recover some of the lost ground, including a rise above the early-August high of 1.1065, the broader sideways to weak bias is unlikely to change. Below 1.0630, the next support comes in at the January low of 1.0480.
Recommended by Manish Jaradi
Trading Forex News: The Strategy
GBP/USD Daily Chart

Chart Created by Manish Jaradi Using TradingView
GBPUSD: Downward bias unchanged
The sequence of lower-highs-lower-lows since July keeps GBP/USD’s short-term bias bearish. For the first time since the end of 2022, cable has fallen below the Ichimoku cloud support on the daily charts – a reflection that the bullish bias has changed. For more discussion, see “Pound’s Resilience Masks Broader Fatigue: GBP/USD, EUR/GBP, GBP/JPY Setups,” published August 23.
However, cable looks oversold as it tests quite strong converged support at the end-May low of 1.2300, near the 200-day moving average. This support is strong, and a break below is by no means imminent. However, A decisive break below the May low of 1.2300 would disrupt the higher-low-higher-high sequence since late 2022. The next significant support is at the March low of 1.1800.
AUD/USD 240-minute Chart
Chart Created by Manish Jaradi Using TradingView
AUD/USD: Backs off from key resistance
AUD/USD has retreated from fairly strong converged resistance at the August high of 0.6525, coinciding with the upper edge of a rising channel since early September. The focus now shifts to the vital cushion at Monday’s low of 0.6415, near the lower edge of the Ichimoku cloud on the 240-minute charts. AUD/USD needs to hold above the support if the recovery from the start of the month has to extend, failing which the immediate bias would shift to range from bullish. Any break below the August-September lows of around 0.6350 could expose downside risks toward the November 2022 low of 0.6270.
Recommended by Manish Jaradi
Confidence is key in trading? But how does one build it?
— Written by Manish Jaradi, Strategist for DailyFX.com
— Contact and follow Jaradi on Twitter: @JaradiManish


Comments are closed.