US Dollar Drips Lower Ahead of Key Fed Decision, Levels to Watch on DXY
US DOLLAR FORECAST:
- U.S. dollar, as measured by the DXY index, slides as traders await critical FOMC decision
- May U.S. inflation data has increased the probability of a Fed pause in the June meeting, but the tightening cycle may not yet be over
- Policymakers' guidance and macroeconomic projections will help set the US dollar's trading bias in the coming days and weeks
Recommended by Diego Colman
Get Your Free USD Forecast
Most Read: S&P 500 Forecast – Bulls Energized after US CPI. Will the Fed Play Spoiler?
The U.S. dollar, as measured by the DXY index, weakened on Tuesday amid market caution ahead of Wednesday's FOMC policy announcement. In late afternoon trading, the greenback gauge was down about 0.3% to 103.30, but was well off its session lows reached immediately after the U.S. CPI report crossed the wires.
U.S. economic data released in the morning, which showed a cooling of annual headline inflation to 4.0% in May, initially weighed on the U.S. currency by leading traders to fully discount a “pause” at this week's Fed meeting. The kneejerk reaction in the FX space, however, faded quickly, as traders concluded the institution could resume hikes in July and keep rates higher for longer.
We will learn more about the outlook for monetary policy tomorrow when the US central bank unveils its June decision along with its updated summary of economic projections. That said, traders should pay close attention to the dot plot to find out how much additional tightening to expect and to see if policymakers intend to ease their posture next year.
Given the resilience of the U.S. economy and sticky core inflation, the dot plot could incorporate one or even two more 25 bp hikes for 2023 and possibly no rate cuts through 2024. This hawkish scenario is likely to skew short-dated nominal yields to the upside, sending the U.S. dollar sharply higher in the near term.
Conversely, if the Federal Reserve refrains from penciling in further rate rises compared to its March estimates and keeps the door open to a less restrictive stance in 2023, all bets are off. This outcome should be quite bearish for both yields and the U.S. dollar.
Recommended by Diego Colman
Trading Forex News: The Strategy
US DOLLAR TECHNICAL ANALYSIS
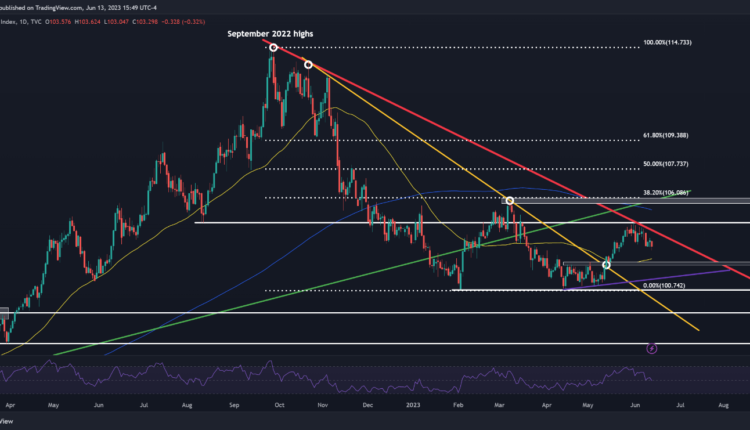
In terms of technical analysis, the U.S. dollar index has been moving lower since the beginning of the month after failing to push above medium-term trendline resistance in play since September of last year. That said, if the decline accelerates in the coming days and weeks, initial support stretches from 102.40 to 102.15. On further weakness, the attention will shift to 101.50.
On the other hand, if buyers regain control of the market and spark a bullish turnaround, the first ceiling to consider lies at the psychological 104.00 level (also trendline resistance). If this barrier is taken out decisively, we could see a move toward 104.70, followed by a possible retest of the 200-day simple moving average.
Recommended by Diego Colman
Traits of Successful Traders
US DOLLAR (DXY) TECHNICAL CHART
US Dollar (DXY) Chart Prepared Using TradingView


Comments are closed.