US Dollar Dancing on Horizontal Support ahead of Fed Decision Next Week
Recommended by Diego Colman
Get Your Free USD Forecast
US DOLLAR OUTLOOK:
- The U.S. dollar has fallen significantly in recent weeks, with the DXY index near yearly lows at the time of writing
- The period of weakness could be prolonged if the Fed adopts a less aggressive stance at its July meeting
- The FOMC is expected to raise rates by 25 basis points, but markets will focus more on guidance
Most Read: Japanese Yen Setups: USD/JPY Hugs Fibonacci Support, EUR/JPY Eyes Key Resistance
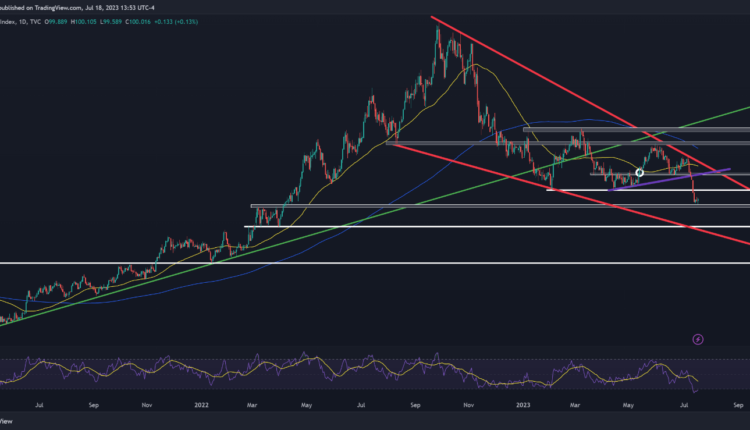
The U.S. dollar, as measured by the DXY index, fell sharply during the first half of the month, but has lacked conviction over the past few trading sessions after stalling at technical support around the psychological 100.00 level.
Consolidation could continue in the coming days as traders look for new catalysts in the market, but next week could see a decisive directional move, with Federal Reserve is due to announce its July monetary policy meeting.
The FOMC is seen resuming its normalization cycle following a brief pause, lifting rates by a quarter-point to 5.25%-5.50%. This upcoming adjustment in the policy stance has been fully priced in, so traders should focus primarily on forward guidance.
Related: How to Trade US Dollar Index – Trading Strategies & Tips
Recommended by Diego Colman
Get Your Free Top Trading Opportunities Forecast
Last month, the U.S. central bank indicated its readiness to implement 50 basis points of additional tightening in the second half of the year, but rapidly weakening price pressures in the economy may warrant a softer posture.
If policymakers embrace a less hawkish approach or give any signs that their hiking campaign has ended, the U.S. dollar is likely to extend its recent slide, as traders begin to position for a full-fledge pivot. This could mean heavy losses for the DXY index.
From a technical standpoint, DXY is hovering above an important area of support, stretching from 99.40 to 99.60 following this month’s selloff. If bears manage to drive prices below this floor in the near term, we could see a slump toward 97.70 moving through the summer.
Conversely, if buyers regain control and trigger a bullish reversal, overhead resistance is located at 100.75. Successfully piloting above this barrier could reinforce upside pressure, setting the stage for a rally toward the psychological 102.00 mark.
Recommended by Diego Colman
Improve your trading with IG Client Sentiment Data
US DOLLAR (DXY) TECHNICAL CHART
US DOLLAR (DXY) Chart Prepared Using TradingView


Comments are closed.