US CPI to Set the Tone for EUR/USD, GBP/USD, USD/JPY
US dollar Vs Euro, British Pound, Japanese Yen – Price Setups:
- The US dollar could maintain a slightly firm tone ahead of US CPI data.
- While the broad bias is down for USD, most recently there have been limited cues from relative monetary outlooks and economic momentum.
- What are the levels to watch in EUR/USD, GBP/USD, and USD/JPY?
Recommended by Manish Jaradi
Forex for Beginners
The US dollar’s trend remains broadly down against the euro, the pound, and the yen. However, it could maintain a slightly firm tone ahead of the key US inflation data due on Wednesday, especially after Friday’s upbeat jobs report.
Jobs data released on Friday suggested the labour market remains tight, keeping the door open for one more Fed rate hike next month. Nonfarm payrolls grew 236k in March, around 239k expected, but the unemployment rate slipped to 3.5% from 3.6% in February. US macro data have been downbeat since the end of March, as reflected in the sharp retreat in the Economic Surprise Index.
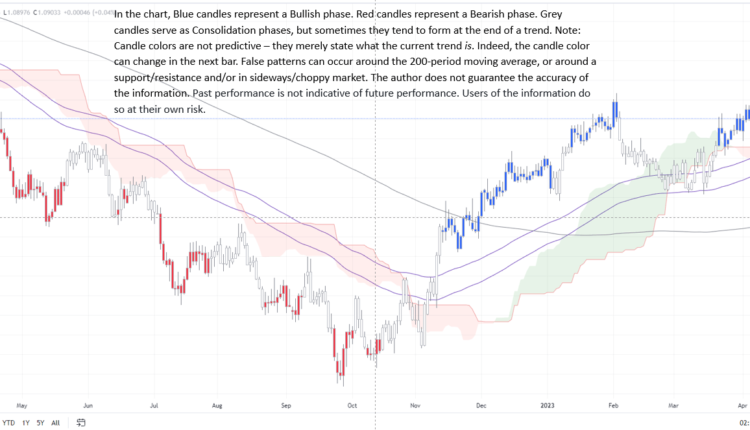
EUR/USD Daily Chart
Chart Created Using TradingView
Still, money markets are pricing in a 65% chance of a 25-basis point rate hike in May, up from 48% a week ago, according to CME’s FedWatch tool. With the jobs data out of the way, the focus now shifts to US CPI data due on Wednesday: headline CPI expected at 5.6% on-year Vs 5.5% in February, while core CPI rose 0.4% on-month in March Vs 0.5% previously.
The broader macro story appears to be more or less similar elsewhere since the end of March, that is, data have been generally less upbeat, including the Euro area, the UK, and Japan. However, core inflation continues to be sticky, limiting central banks’ ability to pause rate hikes.
GBP/USD Daily Chart

Chart Created Using TradingView
EUR: Tough resistance at 1.10
EUR/USD’s trend on the daily timeframe remains up, as the colour-coded candlestick charts, based on trend/momentum indicators, seem to suggest. However, the February high of 1.1035 is a tough barrier to crack, at least until the CPI report. A softer inflation report could lower the hurdle for a move above 1.10. On the downside, there is quite a strong cushion around 1.0785-1.0875, including the 89-period moving average on the 240-minute charts, and the April 3 low of 1.0785. EUR/USD would need to break below the support area for the short-term upward pressure to fade.
GBP: Tough hurdle ahead
GBP/USD continues to be weighed by a tough hurdle at the December high of 1.2450. Nevertheless, the short-term uptrend remains in place, as the slightly upward-sloping channel from last month suggests. Key support is around 1.2275-1.2385, including the lower edge of the channel, the 89-period on the 240-minute charts, and the April 3 low of 1.2275. The upward pressure is unlikely to fade while the support is intact. On the upside, as noted in arecent update, any break above 1.2450 could potentially open the door for meaningful gains in GBP/USD.
USD/JPY Daily Chart
Chart Created Using TradingView
USD/JPY: Is a base getting defined?
USD/JPY’s broader trend remains down, as the colour-coded candlestick charts based on trend/momentum indicators suggest. Most recently, though, the pair appears to be finding support around129-130, including the 89-week moving average and the lower edge of the Ichimoku cloud on the weekly charts. On the upside, any break above the immediate resistance at the April 3 high of 133.75 would confirm that the immediate downward pressure had faded for now, raising the prospect of a broad range of 129-138.
Trade Smarter – Sign up for the DailyFX Newsletter
Receive timely and compelling market commentary from the DailyFX team
Subscribe to Newsletter
— Written by Manish Jaradi, Strategist for DailyFX.com
— Contact and follow Jaradi on Twitter: @JaradiManish


Comments are closed.