Unraveling the implications of potential false breakout
Today's technical analysis focuses on the German DAX, an index currently undergoing intriguing movements worth noting. As the new week unfolds, indices globally are taking positive strides. This might be attributable to the correction which began last Friday. To some, like myself, this correction appeared more as a take-profit move following a particularly bleak week. However, current market dynamics show buyers interpreting this as an impetus to push prices higher, especially today.
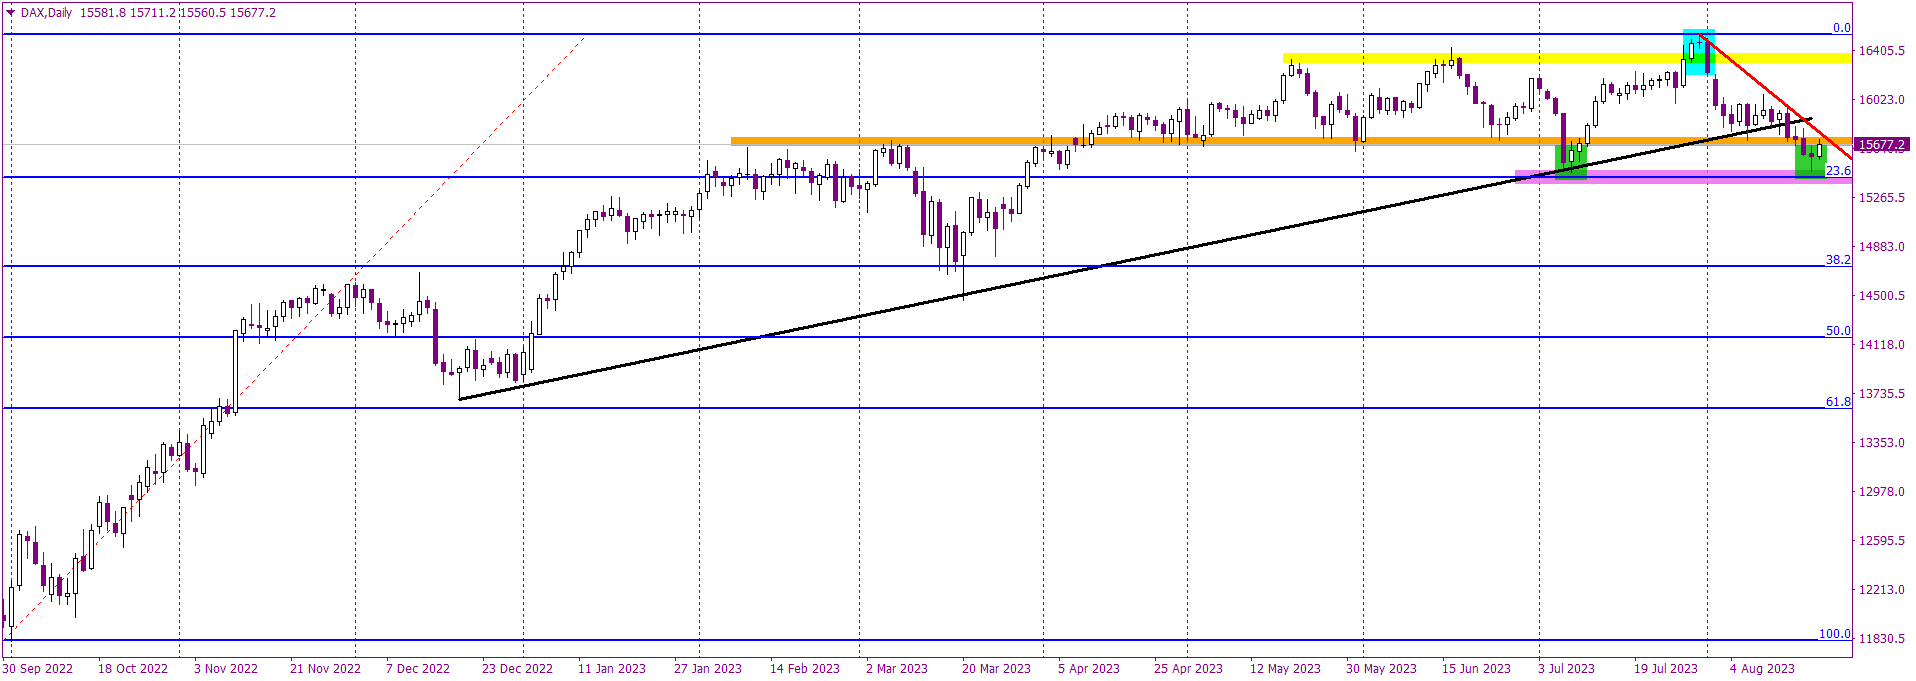
Zooming in on the DAX, the spotlight is on its trajectory towards the 15,700 points resistance, which can be distinctly identified on the chart with an orange hue. This level isn't just another resistance; it's of paramount significance for the DAX. If the price surpasses this region, it might be an indication of another false breakout below this threshold. A similar event transpired in July, identifiable with a green shade on the chart. Should history repeat itself, it will mark yet another episode of false breakouts for the DAX.

Further amplifying the bullish narrative is the potential breach of the red mid-term downtrend line, which has been holding the reins since August, ensuring the index's decline doesn't spiral out of control. A pivotal observation emerging in this mix is the new support level, aligned with the 23.6% Fibonacci retracement. As days pass, the importance of this Fibonacci level is increasing, overshadowing even the 15,700 points benchmark. This pivot might soon become the primary focal point for traders and analysts alike.
In a nutshell, should the DAX price manage to soar above both the orange resistance and the red downtrend line, it would unmistakably be an invitation for buyers to join the party. Conversely, if the price finds itself repelled from these heights and subsequently breaches the 23.6% Fibonacci level, it would be a clarion call for sellers, marking an optimal short-selling opportunity.


Comments are closed.