

KOSPI, KOREA COMPOSITE STOCK PRICE INDEX, TOPIX, TOKYO STOCK PRICE INDEX – TECHNICAL OUTLOOK:
- TOPIX is on the verge of a breakout from a multi-month sideway pattern.
- A potential reverse head & shoulders in KOSPI.
- What are the key levels to watch?
Recommended by Manish Jaradi
Traits of Successful Traders
TOPIX TECHNICAL OUTLOOK – BULLISH
Tokyo Stock Exchange’s TOPIX and Korea Stock Exchange’s KOSPI are gearing for a bullish break that could potentially lead to gains of around 8%-14%.
TOPIX has been in a broad range since a year. The price action within the range can be interpreted either as an ascending triangle from March 2022, or a slightly upward-sloping channel also from March. The price objective of both the patterns is more or less similar, that is, the width of the pattern, but the breakout point would vary.
TOPIX Weekly Chart
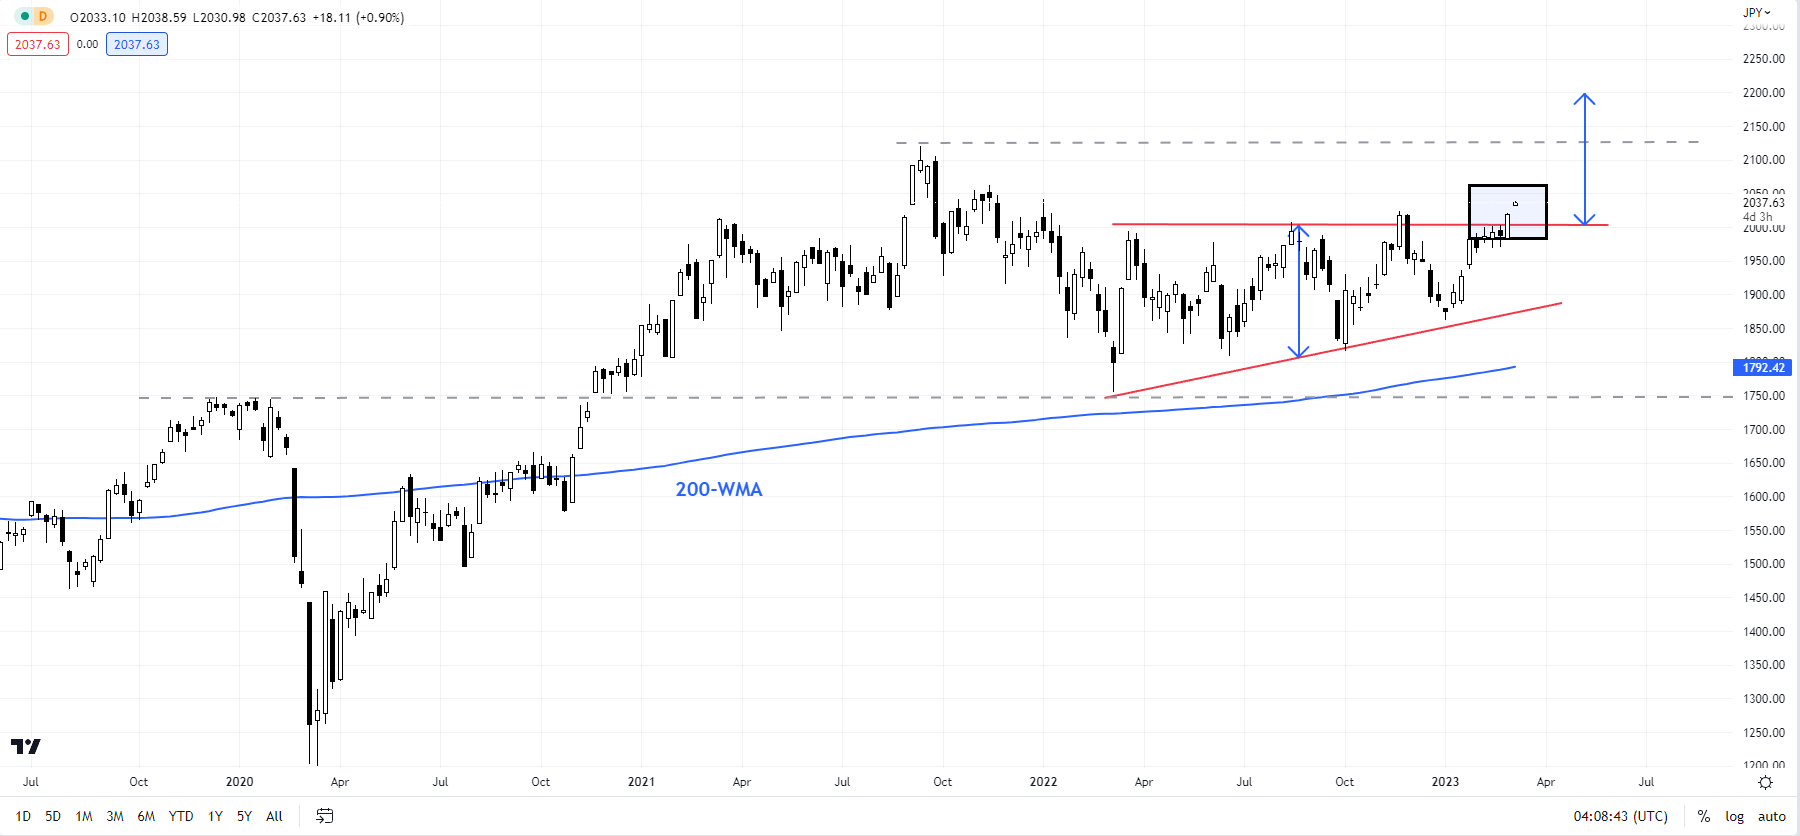
Chart Created Using TradingView
Monday’s jump appears to be triggering a break out from the ascending triangle, near the top end of the channel. It might be prudent to wait for a crack in the channel ceiling before concluding the bullish break. Such a break could open the way toward 2200 (around 8% from Monday’s close). On the downside, the index needs to hold above the immediate cushion at the early-February low of 1961 for the bullish pressure to remain intact.
TOPIX Daily Chart
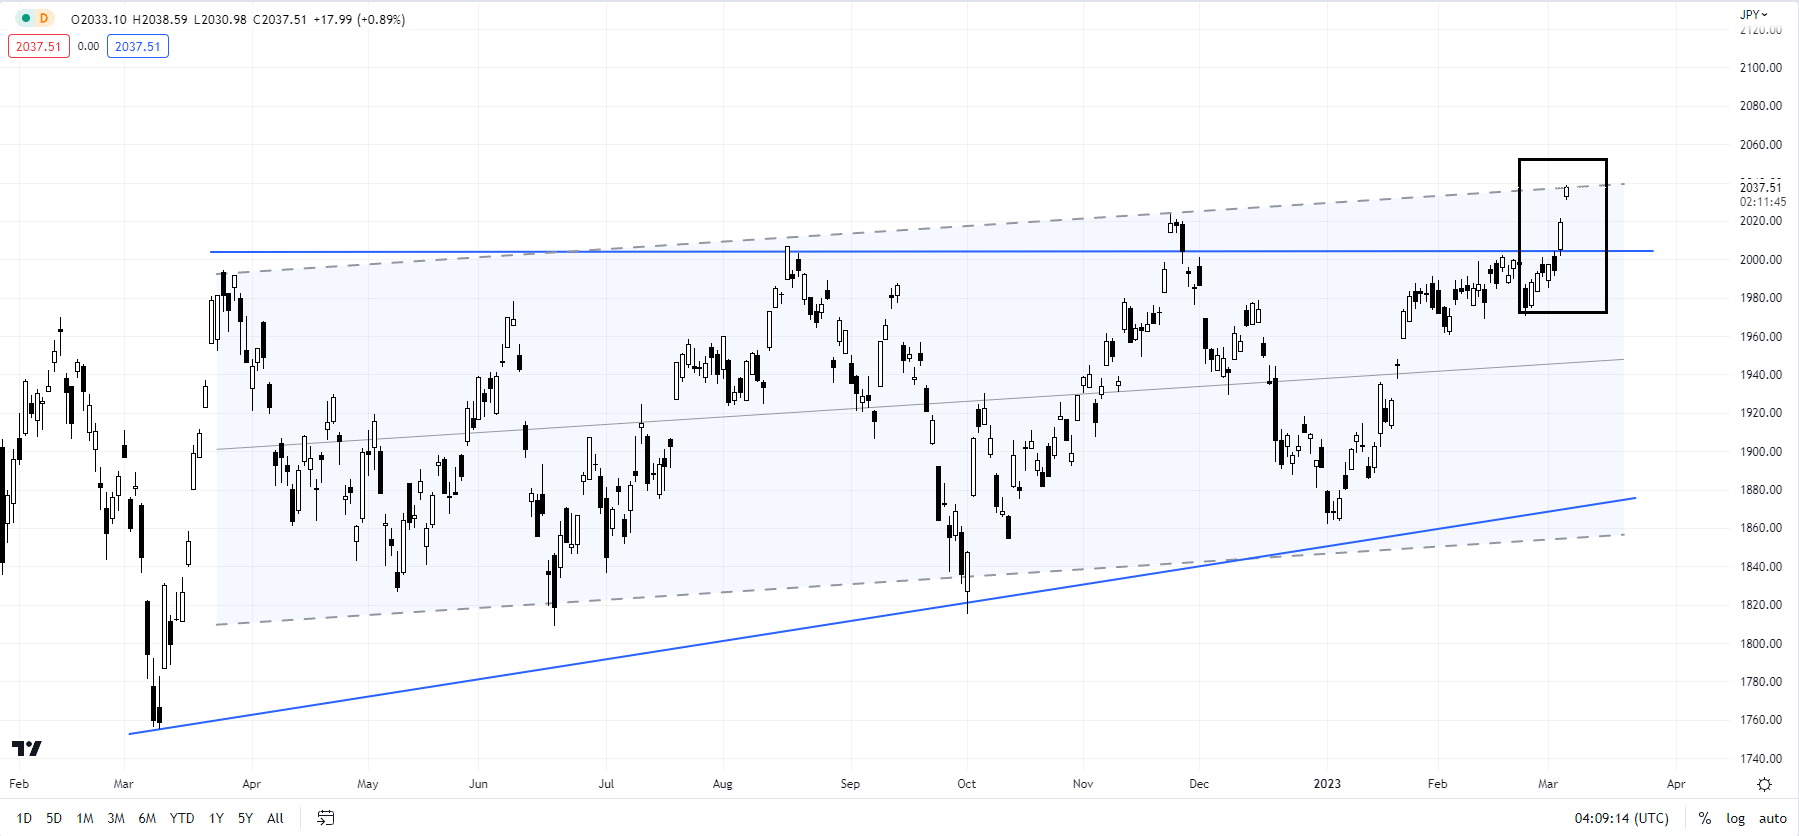
Chart Created Using TradingView
KOSPI TECHNICAL OUTLOOK – BULLISH
KOSPI has essentially been directionless since the end of January. However, the price action from mid-2022 appears to be a potential reverse head & shoulders pattern (the left shoulder is the mid-2022 low, the head is the September low, and the right shoulder is the early-January low). A decisive break (2 daily closes) above the marginally downward-sloping trendline from August 2022 (at about 2475) could pave the way toward 2800 (about 14% from Monday’s close).
KOSPI Daily Chart
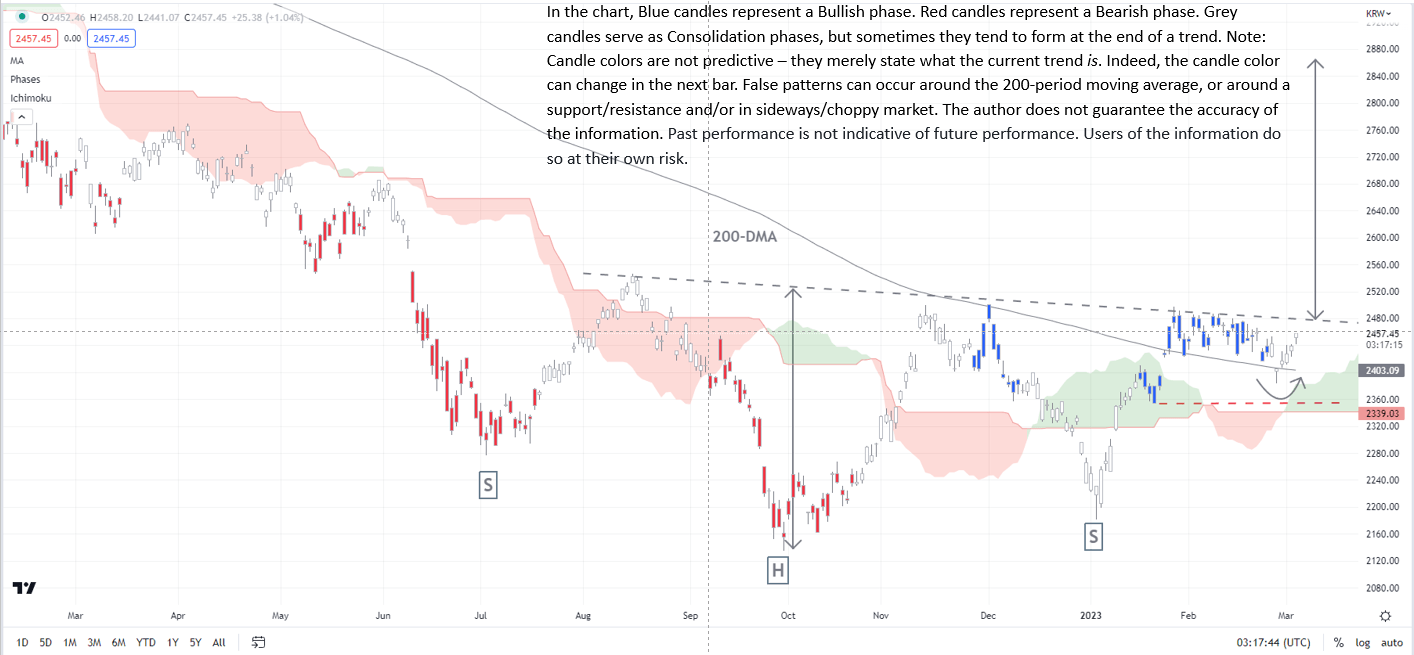
Chart Created Using TradingView
As highlighted in an earlier update, the bullish break would also coincide with a rise above the 200-day moving average for the first time since late 2021 – a sign that the multi-month downward pressure was fading. On the downside, KOSPI needs to hold above immediate support at the mid-January low of 2357 for the bullish view to unfold.
Trade Smarter – Sign up for the DailyFX Newsletter
Receive timely and compelling market commentary from the DailyFX team
Subscribe to Newsletter
— Written by Manish Jaradi, Strategist for DailyFX.com
Comments are closed.