

US Dollar, Euro, EUR/USD, EUR/GBP, EUR/JPY – Outlook:
- EUR/USD’s six-month change and positioning are around extremes.
- EUR/GBP has fallen below crucial support.
- The upward pressure in EUR/JPY has eased slightly.
Recommended by Manish Jaradi
How to Trade EUR/USD
Overbought conditions, stretched positioning, and growing doubts about whether the US Federal Reserve will pause at its next meeting have triggered a pause in the euro’s rally. While the outlook differs across crosses, the retreat doesn't suggest EUR/USD's uptrend is over.
The pace of EUR/USD gains in recent months has been quite sharp – the six-month change is the highest at least since 2017. While the surge in momentum bodes well for the medium-term outlook, in the near-term chances are that the gains could slow or even reverse a bit, given the mean-reverting nature of the series (see the chart) – the drop in the pair could be a sign that this is already happening.
EUR/USD 6-Month Change
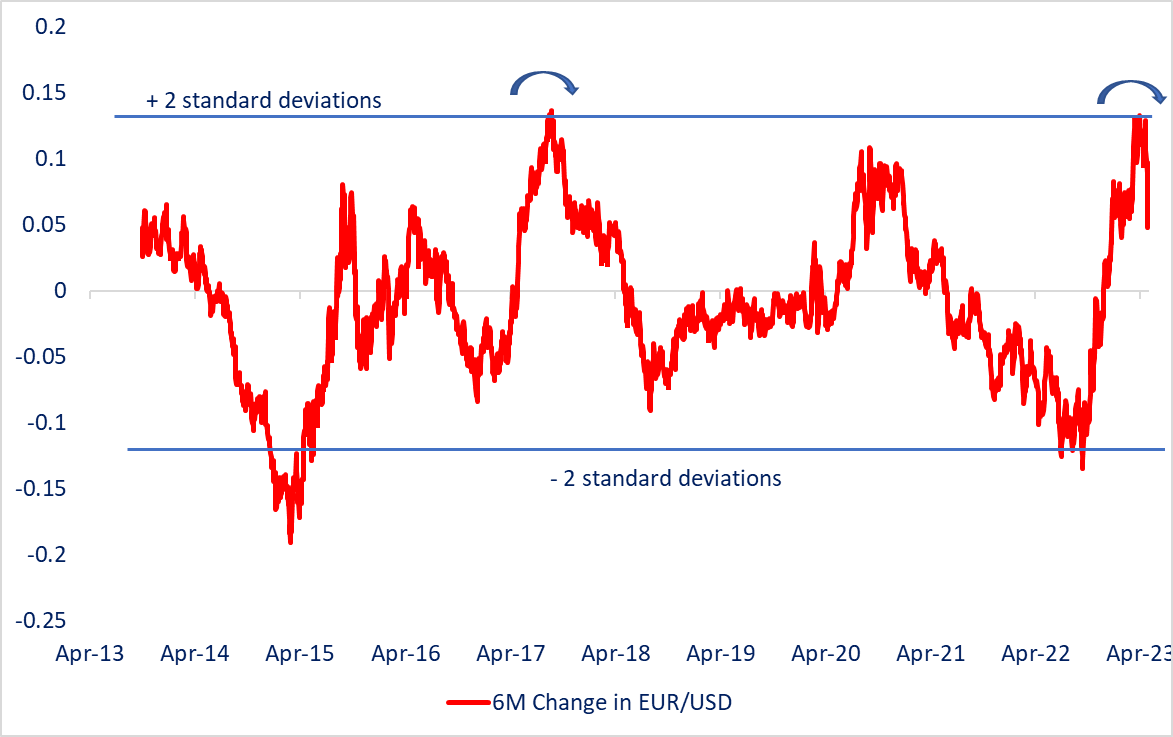
Source Data: Bloomberg; Chart prepared in Microsoft Excel.
Long speculative EUR positioning has been the highest since 2020 and also within the major currency space (see chart), suggesting overcrowded conditions for the single currency.
Furthermore, Euro area macro data has underwhelmed since early February, suggesting ECB rate hikes are trickling through the economy. Data released yesterday showed Euro area industrial output fell more than expected in March as the output of capital goods dropped. The ECB maintained a hawkish stance at its last meeting earlier this month, and money markets see two more rate hikes by October.
FX Speculative Positioning
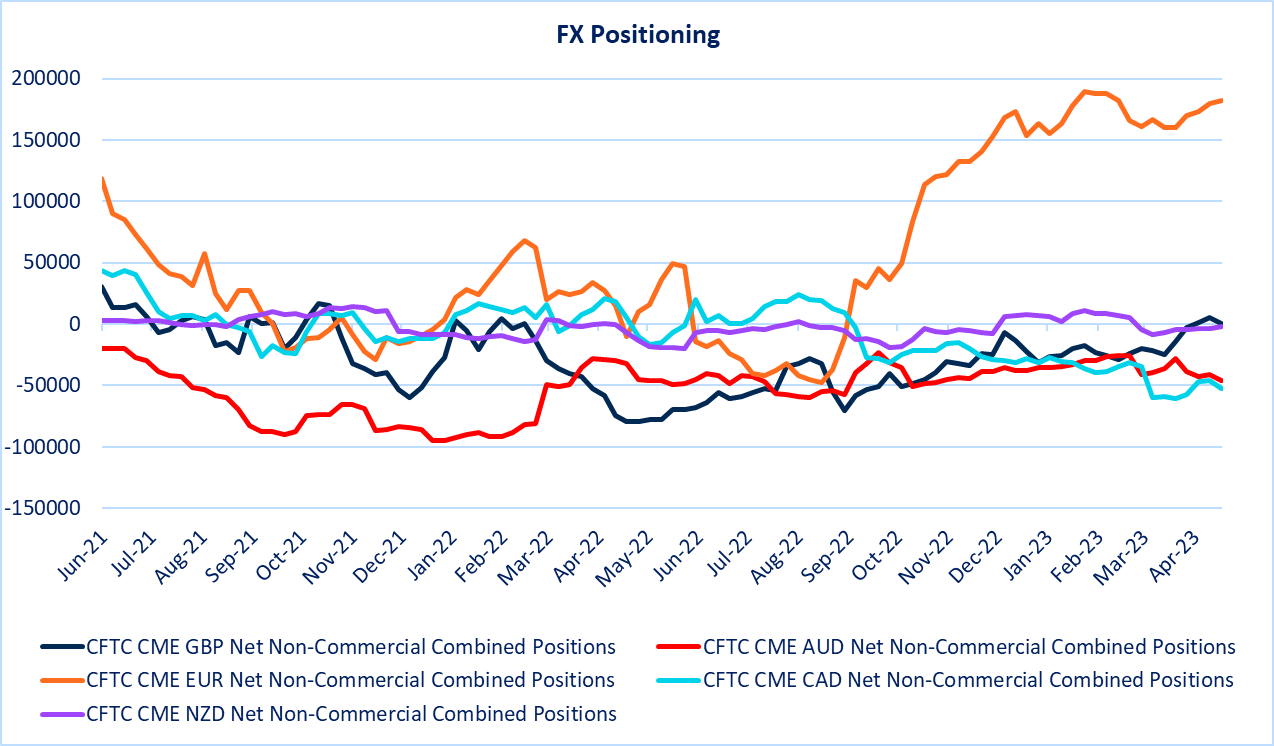
Source Data: Bloomberg; chart prepared in Microsoft Excel.
Recent US Fed speak has tilted toward the hawkish side, leading to a reassessment of the pause priced in at the June meeting. Markets are pricing in a 20% chance of a 25 bps Fed rate hike at the June meeting up from 15% a week ago, according to the CME FedWatch tool.
EUR/USD Daily Chart
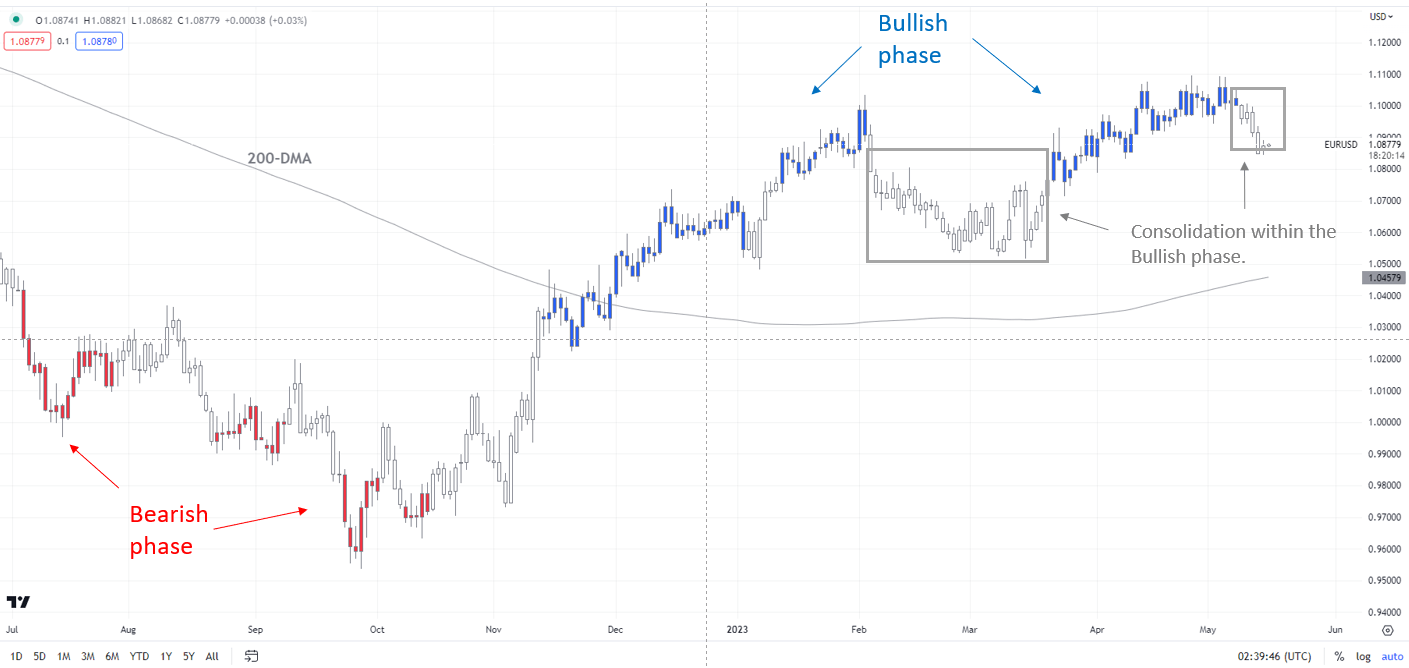
Chart Created by Manish Jaradi Using TradingView; Notes at the bottom of the page.
EUR/USD: A consolidation within the uptrend
As the colour-coded candlestick daily charts, based on trending/show, EUR/USD has moved to a consolidation phase recently within the broader uptrend – a risk that was highlighted in the previous update. See “Did ECB Just Put Brakes on Euro’s Rally? EUR/USD, EUR/AUD, EUR/JPY”, published May 5.
EUR/USD Daily Chart
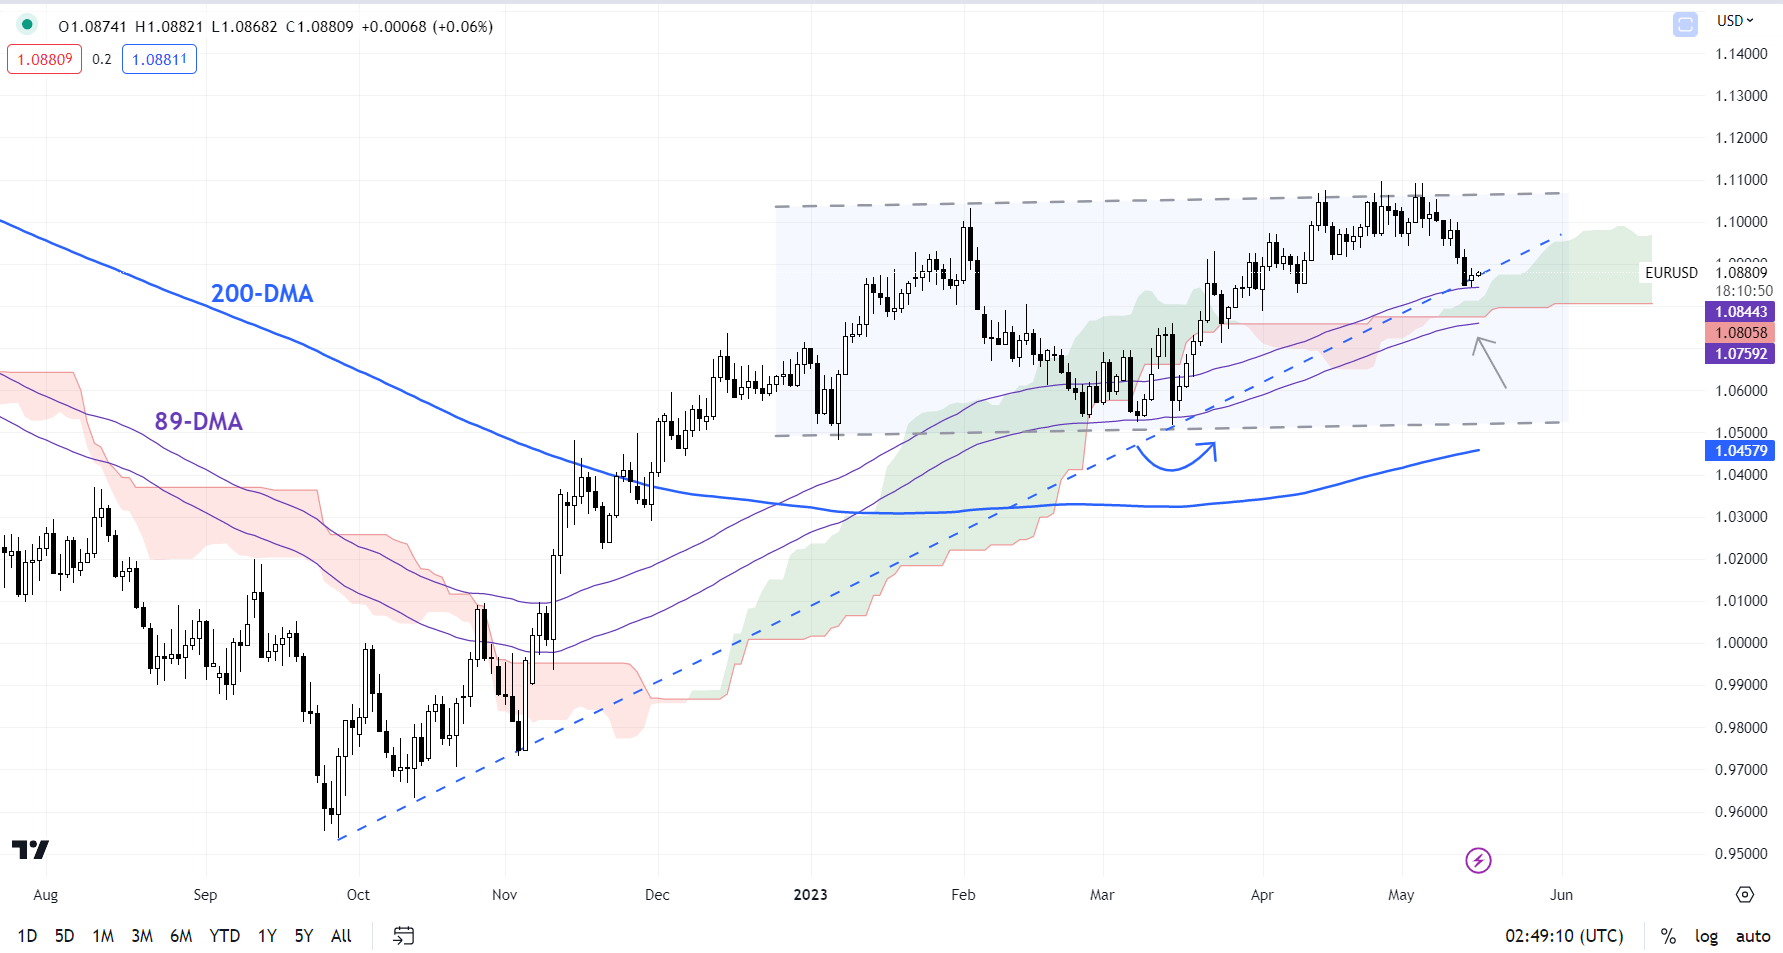
Chart Created by Manish Jaradi Using TradingView
EUR/USD’s break below minor support at the early-May low of 1.1000 indicates that the upward pressure has faded a bit. Still, there is fairly tough converged support on the 89-day moving average, coinciding with the lower edge of the Ichimoku cloud on the daily chart. A stronger cushion is at the March low of 1.0510.
EUR/GBP Daily Chart
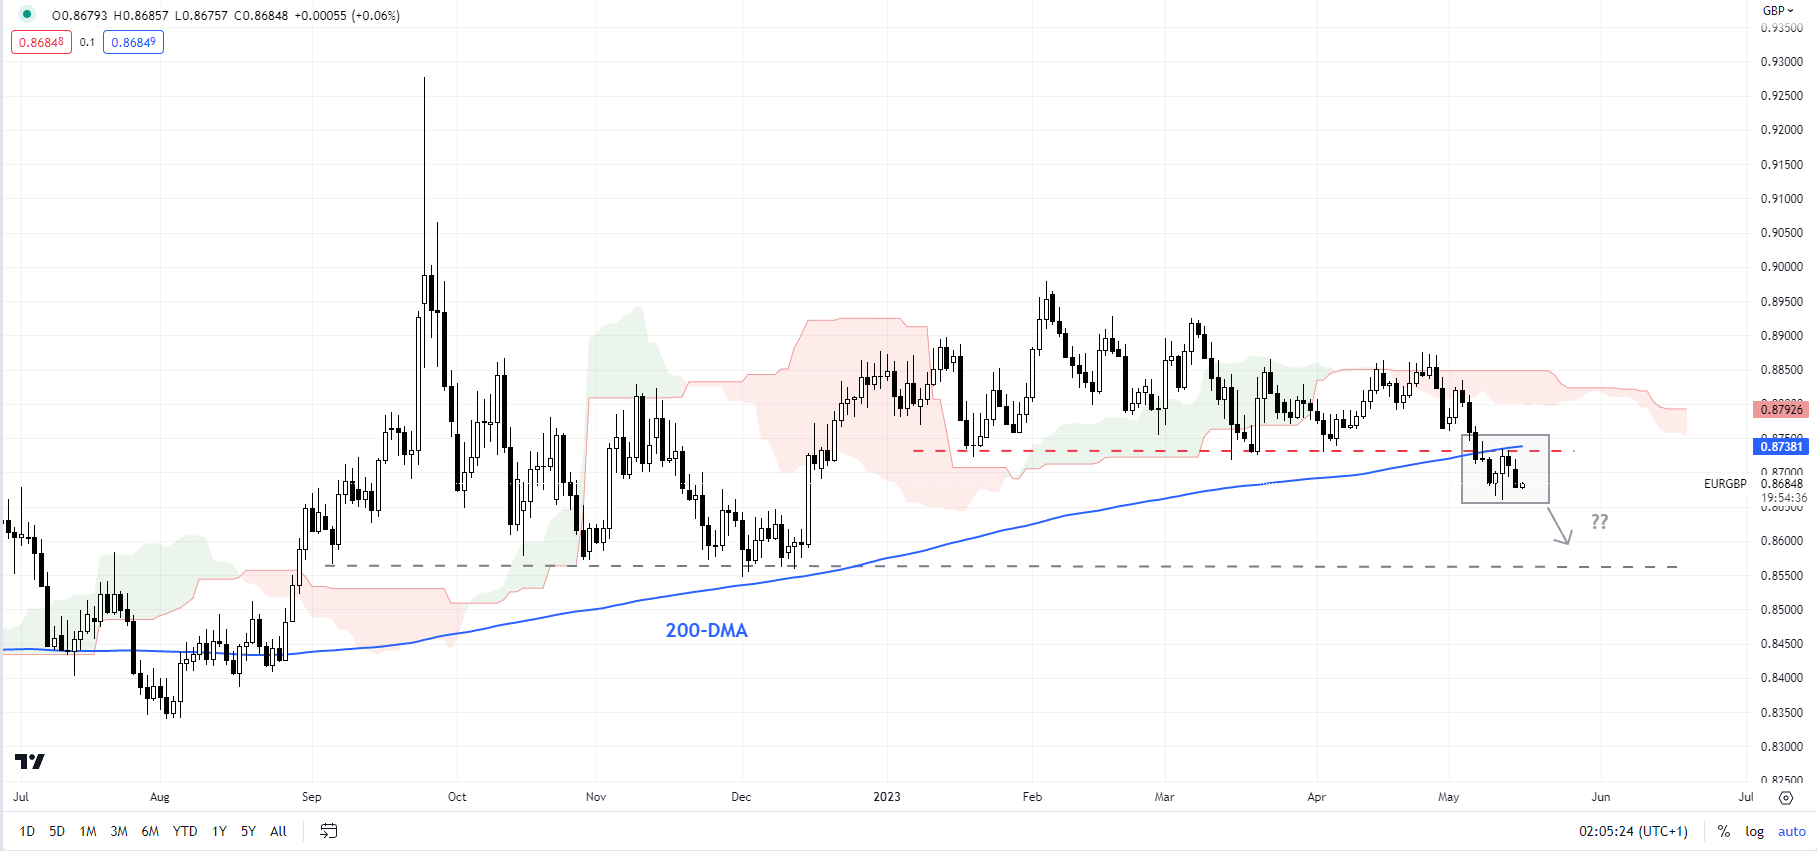
Chart Created by Manish Jaradi Using TradingView
EUR/GBP: Crashes through support
EUR/GBP’s break below key horizontal trendline support at about 0.8725 has triggered a break from a multi-week sideways pattern. The break has opened the way toward the December low of 0.8545.
EUR/JPY 240-minute Chart
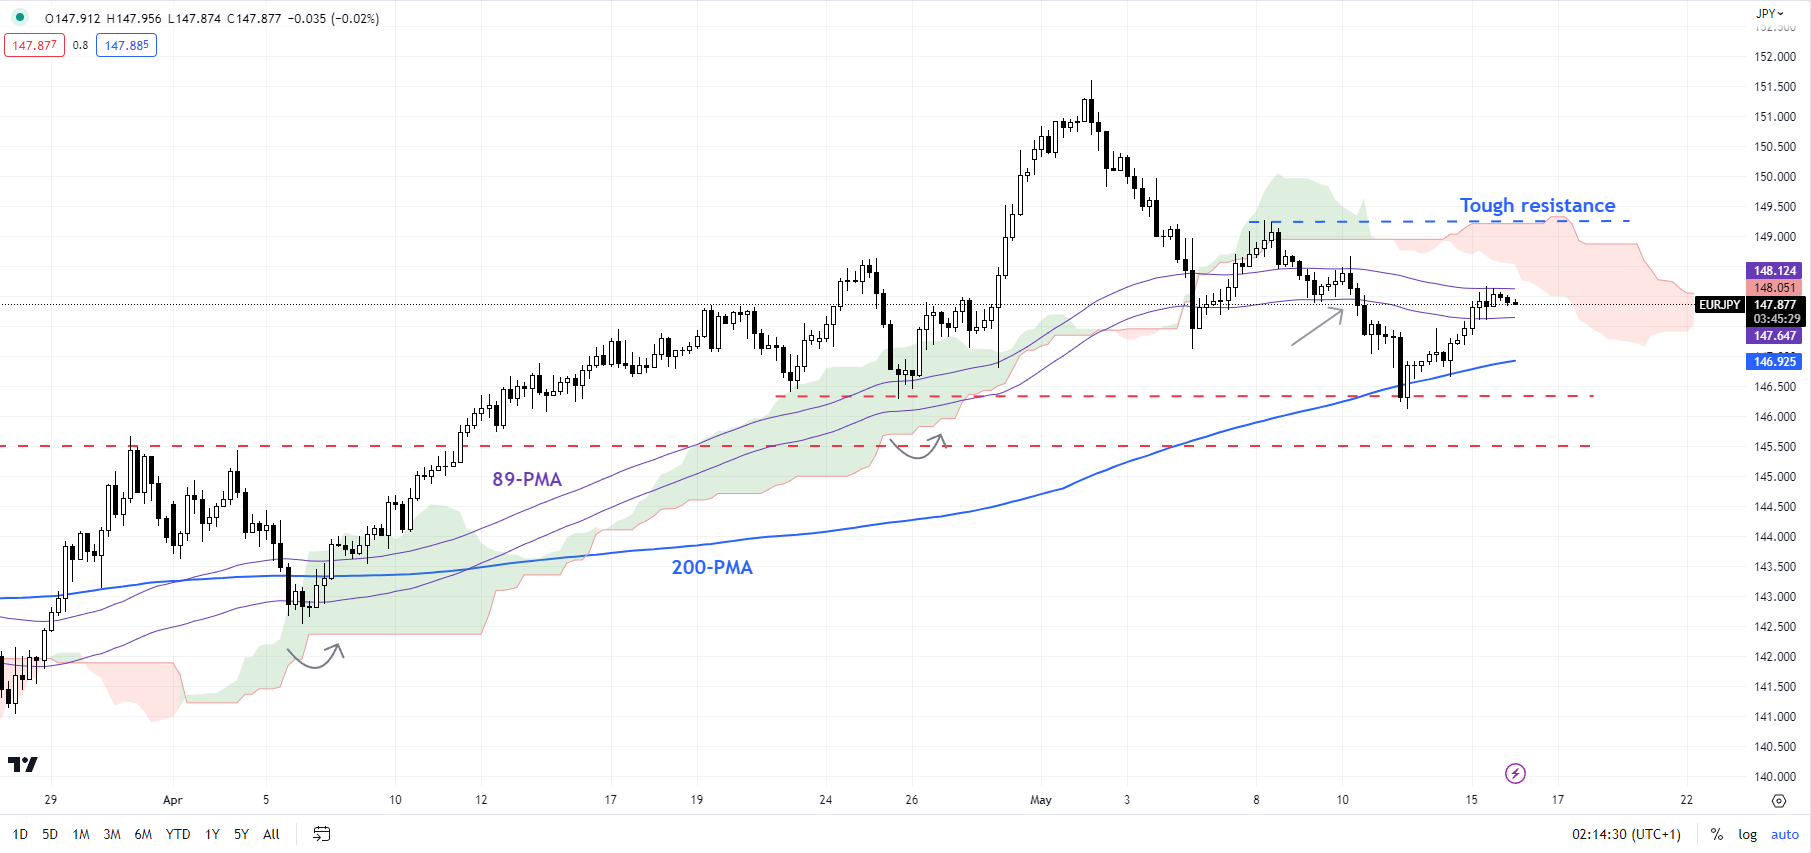
Chart Created by Manish Jaradi Using TradingView
EUR/JPY: Upward pressure has faded a bit
EUR/JPY’s fall below the vital floor on the 89-period moving average and the Ichimoku cloud on the 240-minute chart confirms that the upward pressure has faded somewhat for now. A decisive break below the late-April low of 146.25 would confirm that the trend had changed from sideways to slightly down.On the upside, EUR/JPY could find it tough to crack the May 8 high of 149.25.
Note: In the above colour-coded candlestick chart, Blue candles represent a Bullish phase. Red candles represent a Bearish phase. Grey candles serve as Consolidation phases (within a Bullish or a Bearish phase), but sometimes they tend to form at the end of a trend. Note: Candle colors are not predictive – they merely state what the current trend is. Indeed, the candle color can change in the next bar. False patterns can occur around the 200-period moving average, or around a support/resistance and/or in sideways/choppy market. The author does not guarantee the accuracy of the information. Past performance is not indicative of future performance. Users of the information do so at their own risk.
Trade Smarter – Sign up for the DailyFX Newsletter
Receive timely and compelling market commentary from the DailyFX team
Subscribe to Newsletter
— Written by Manish Jaradi, Strategist for DailyFX.com
— Contact and follow Jaradi on Twitter: @JaradiManish
Comments are closed.