Surges above 0.9000 as bulls eyeing 50-day EMA
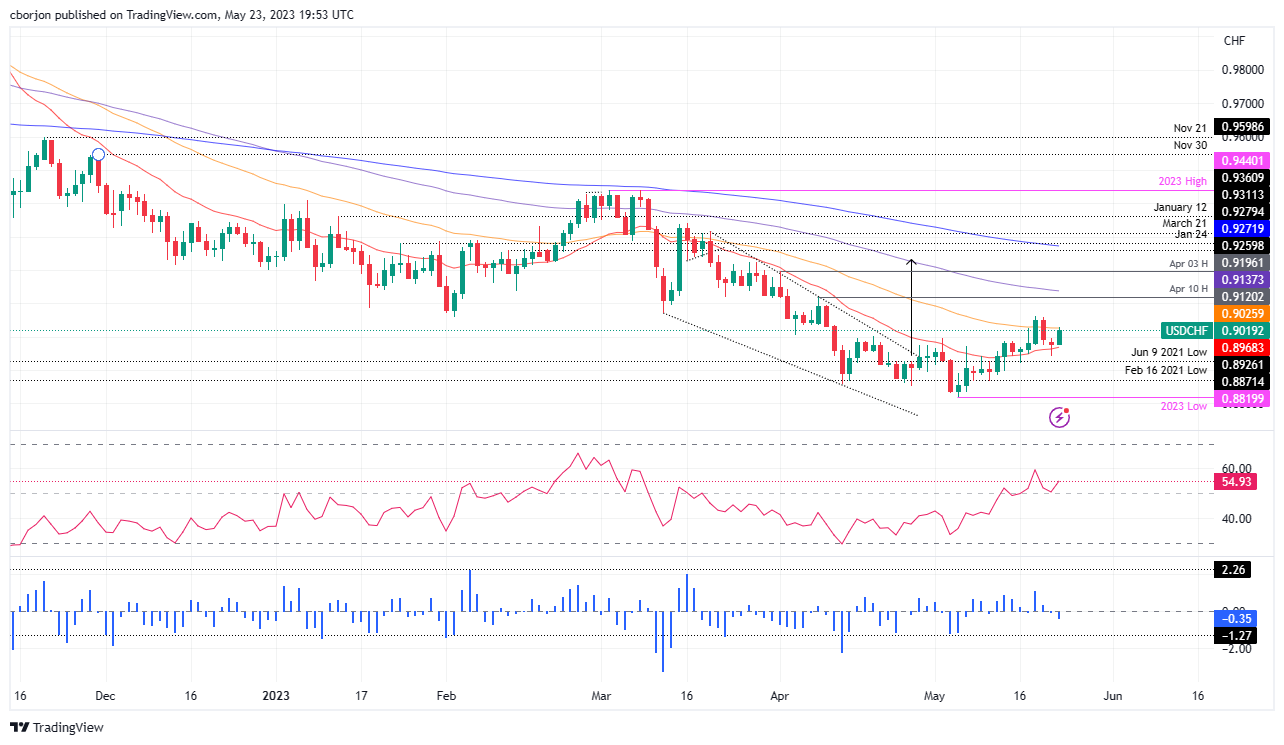
- USD/CHF pair surges past the 0.9000 figure, aiming for a 50-day EMA test at 0.9025 after printing a bullish hammer on the daily chart, turning bias to neutral upwards.
- USD/CHF rally could challenge the 100-day EMA at 0.9137 if the 50-day EMA is breached, setting sights on the April 3 daily high of 0.9196.
- Despite a neutral 3-day RoC, RSI indicates a bullish turn, suggesting USD/CHF bulls are gathering momentum.
USD/CHF climbs above the 0.9000 figure, eyeing a 50-day Exponential Moving Average (EMA) test at 0.9025 after printing a bullish hammer in the daily chart. The USD/CHF is trading at 0.9015, after hitting a daily low of 0.8975, trades above its opening price by 0.42%.
USD/CHF Price Analysis: Technical outlook
The USD/CHF pair is neutral to downward biased unless it claims the 50-day EMA at 0.9025, which would turn the bias to neutral upwards. It should be said the USD/CHF printed a new daily high, above the May 2 high of 0.8995, opening the door for further upside. If USD/CHF cracks the 50-day EMA, the pair will test last week's high of 0.9063 before rallying toward the 0.9100 mark. That would further cement a bullish bias, with the USD/CHF about to challenge the 100-day EMA at 0.9137, on its way to the April 3 daily high of 0.9196.
Notably, the Relative Strength Index (RSI) indicator turned bullish and just bounced off the 50-midline, a sign of USD/CHF bulls gathering momentum; while the 3-day Rate of Change (RoC) remains neutrally biased.
Therefore, the USD/CHF trend would likely continue upward. On the downside, the USD/CHF's first support would be the 0.9000 figure, which, once cleared, the pair would dip to the 20-day EMA At 0.8968.
USD/CHF Price Action – Daily chart


Comments are closed.