

S&P 500 spends early part of this week in consolidation after 1.8% advance in previous week
- President Joe Biden signed a bill to raise the debt ceiling on Saturday.
- Apple introduces VR headset on Monday, but AAPL stock caves.
- May jobs report last Friday gives lower probability of June Fed rate hike.
- Stitch Fix, DocuSign, Nio report earnings this week.
The S&P 500 index is unsure where to move now that the US debt ceiling standoff has been dealt with. President Joe Biden signed the agreement into law on Saturday that will lift the debt ceiling until 2025, which should put the markets at ease now that a politically-caused US debt default is out of the picture. However, last Friday’s jobs report makes it less likely that the Federal Reserve (Fed) hikes interest rates on June 14. Even though the Fed decision comes down next week, the lack of significant data on the schedule this week leaves markets more focused on next Wednesday.
Despite the stock rallying in advance, Apple’s (AAPL) much-touted unveiling of its virtual reality headset hurt the S&P 500 index on Monday when the index’s largest stock fell 0.8%. Though many were wowed by the technology, most of the negativity surrounded the Apple Vision Pro’s $3,499 price tag. AAPL stock dropped another 1% in the first half hour of Tuesday's session.
At the time of writing in Tuesday’s premarket, both S&P 500 and NASDAQ 100 futures are slightly in the red but not by much.
S&P 500 News: Markets look ahead to FOMC meeting
Last Friday’s May Nonfarm Payrolls figure of 339,000 blasted expectations out of the water. Various consensus forecasts thought the US labor market would decline to between 185K and 195K new hires. Instead, the US economy produced 339,000 new positions, demonstrating that a recession does not seem to be emerging. However, 440,000 new layoffs overpowered that strong jobs figure, and unemployment jumped from 3.4% to 3.7%. Additionally, the YoY average hourly wage figure ticked down to 4.3%, so the market took this report as a sign that the Fed’s hikes have worked.
The CME FedWatch Tool just one week ago had a 66% chance of a 25-basis-point hike. Now the gauge has dropped to 25%. It seems the market believes hikes may end this month, which is of course bullish for the S&P 500. However, observers do not think the Federal Reserve is likely to cut rates anytime soon. The market leapt higher on Friday, but Monday saw a less enthusiastic response as the S&P 500 lost 0.2%.
Still, the lack of significant data this week leaves many traders sitting tight until June 14, when certainty over the Fed should lead to action in the markets.
S&P 500 FAQs
What is the S&P 500?
The S&P 500 is a widely followed stock price index which measures the performance of 500 publicly owned companies, and is seen as a broad measure of the US stock market. Each company’s influence on the computation of the index is weighted based on market capitalization. This is calculated by multiplying the number of publicly traded shares of the company by the share price. The S&P 500 index has achieved impressive returns – $1.00 invested in 1970 would have yielded a return of almost $192.00 in 2022. The average annual return since its inception in 1957 has been 11.9%.
How are companies chosen to be included in the S&P 500?
Companies are selected by committee, unlike some other indexes where they are included based on set rules. Still, they must meet certain eligibility criteria, the most important of which is market capitalization, which must be greater than or equal to $12.7 billion. Other criteria include liquidity, domicile, public float, sector, financial viability, length of time publicly traded, and representation of the industries in the economy of the United States. The nine largest companies in the index account for 27.8% of the market capitalization of the index.
How can I trade the S&P 500?
There are a number of ways to trade the S&P 500. Most retail brokers and spread betting platforms allow traders to use Contracts for Difference (CFD) to place bets on the direction of the price. In addition, that can buy into Index, Mutual and Exchange Traded Funds (ETF) that track the price of the S&P 500. The most liquid of the ETFs is State Street Corporation’s SPY. The Chicago Mercantile Exchange (CME) offers futures contracts in the index and the Chicago Board of Options (CMOE) offers options as well as ETFs, inverse ETFs and leveraged ETFs.
What factors drive the S&P 500?
Many different factors drive the S&P 500 but mainly it is the aggregate performance of the component companies revealed in their quarterly and annual company earnings reports. US and global macroeconomic data also contributes as it impacts on investor sentiment, which if positive drives gains. The level of interest rates, set by the Federal Reserve (Fed), also influences the S&P 500 as it affects the cost of credit, on which many corporations are heavily reliant. Therefore, inflation can be a major driver as well as other metrics which impact the Fed decisions.
Data: ISM PMI demonstrates a possible slowing economy
On Monday, the Institute of Supply Management’s (ISM) Services Purchasing Managers Index (PMI) gave a reading of 50.3, which demonstrates a barely expanding services sector. Analysts had been expecting a 51.5 reading, and April saw the figure arrive at 51.9. Also the Prices Paid ISM survey showed prices in the services sector falling, as well as a reduction in employment.
The slowdown in growth is now viewed less as the sign of an impending recession, but rather just a cooldown for an overheated economy. It does jibe with a number of retail businesses cutting their 2023 outlooks during earnings calls over the past month. On Monday, KeyBanc gave Target (TGT) a downgrade based on expected softness in consumer spending.
Washington’s debt ceiling agreement forces over 27 million US borrowers to restart the payment of their student loans come August or September. This should cut more than $11 billion in monthly spending power from this cohort. UBS analyst Jay Sole issued a research over the weekend saying that clothing brands, including Nike (NKE), will likely also get hit hardest.
Earnings of the week
Tuesday, June 6 – Stitch Fix (SFIX), J. M. Smucker (SJM)
Wednesday, June 7 – GameStop (GME), Campbell Soup (CPB)
Thursday, June 8 – DocuSign (DOCU)
Friday, June 9 – Nio (NIO)
What they said about the market – Mark Zandi
Mark Zandi, the chief economist at Moody’s Analytics, said he sees lots of reasons to expect a coming recession, but the labor market and consumer spending are so far holding up against a major downturn.
“At the end of the day, it’s about the consumer, which is the firewall between recession and no recession.”
S&P 500 forecast
The S&P 500 may just be consolidating a bit this week in light of next week’s Fed rate decision. The index is already up 12% year to date, and the completion of a debt-ceiling agreement led the S&P 500 to add 1.83% last week. Now traders are looking around for guidance, it would appear.
Now firmly above the 4,200 resistance at 4,273 at Monday’s close, S&P 500 bulls will surely hold until they can sell at the 4,325 level that remains the index’s high since August 2022. In the meantime, the 4,200 level and the nearby 9-day moving average should provide support until bulls can reach last August’s high. The Relative Strength Index (RSI) is above the halfway mark but not yet in overbought territory. This means there is almost certainly more room to run.
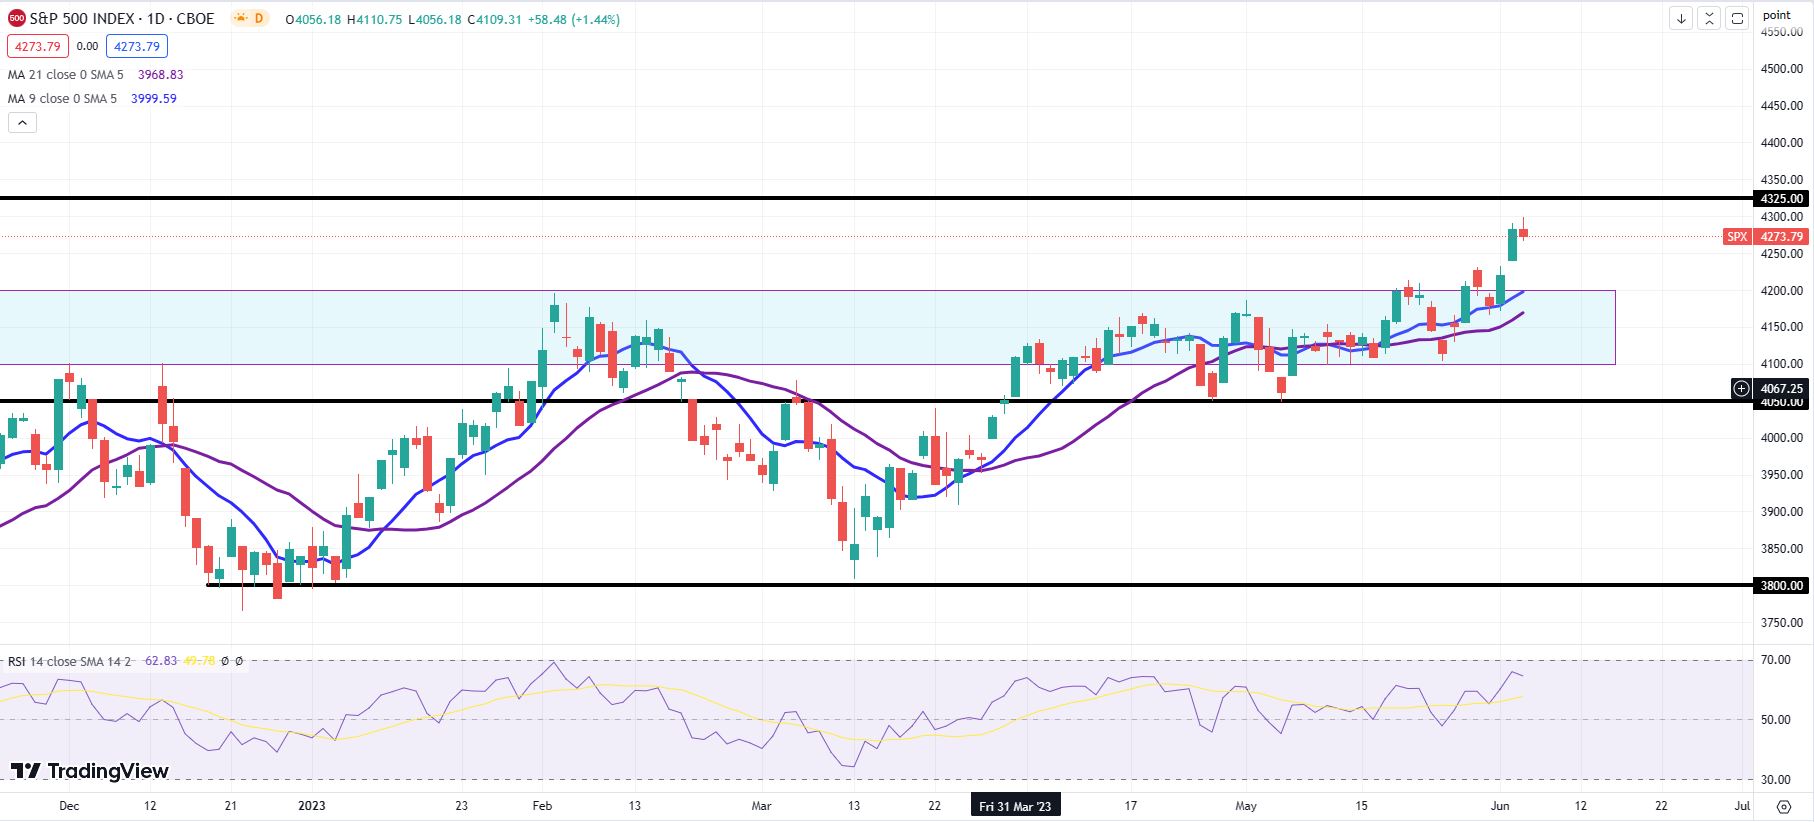
S&P 500 daily chart
Comments are closed.