S&P 500, NAS100 Continue Advance on Dovish Fed Rhetoric
S AND P 500 & NAS100 PRICE FORECAST:
MOST READ: Dollar Index (DXY) Retreats Helping USD/JPY Tick Lower, 145.00 Incoming?
US Indices have shrugged off the risk of tone which kicked of trading this week as for the moment at least market participants appear at ease that the conflict in Israel will remain confined. Early on Monday markets appeared concerned of the potential fallout from the conflict which could perhaps drag other Nations in as well,
Elevate your trading skills with an extensive analysis of the Japanese Yens prospects, incorporating insights from both fundamental and technical viewpoints. Download your free Q4 guide now!!
Recommended by Zain Vawda
Get Your Free Equities Forecast
FED POLICYMAKERS GIVE DOVISH SIGNALS
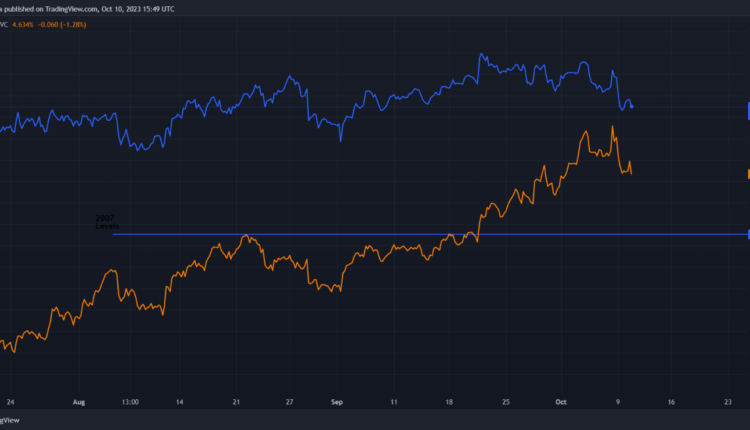
Risk assets have received a boost since yesterday's US session as top Fed policymakers hinted that the higher long-term Yields are the lower the probability that further rate hikes would be needed. This rhetoric saw the gaps on US futures close and gains continued into today as Fed policymaker Bostic reiterated a similar dovish tone. Bostic stated that the Fed do not see the need to increase rates anymore.
These comments appear to be helping sentiment at the moment and keeping US equities supported.
US 2Y and 10Y Yield Chart
Source: TradingView, Created by Zain Vawda
If the conflict in Israel remains contained markets focus will shift to US PPI and CPI data with a massive beat likely to reignite chatter of tighter policy and thus weigh on US equities. Friday we also have the bank earnings being released.
Recommended by Zain Vawda
Get Your Free Top Trading Opportunities Forecast
The Fed minutes out tomorrow might prove a waste of time given the dovish narrative from policymakers already priced in.
RISK EVENTS FOR THE WEEK AHEAD

For all market-moving economic releases and events, see theDailyFX Calendar
S&P 500 TECHNICAL OUTLOOK
Form a technical perspective, the S&P has bounced off a key area of support before the futures closed the gap and continued higher this morning. There are some headwinds just up ahead though as we have the 50 and 100-day MAs resting around the 4414 mark.
The 50 and 100-day MA are giving early signals of a potential death cross which would contradict the current rally to the upside as well as the momentum. A break of the 4414 resistance area could see the SPX make a run toward the descending trendline currently in play .
S&P 500 October 10, 2023
Source: TradingView, Chart Prepared by Zain Vawda
NAS100 TECHNICAL OUTLOOK
The correlation with the Nasdaq of late has been interesting to watch as it almost identically resembles recent price action on the SPX. Having broken above the 100-day MA (even though a death cross) did appear with the next key resistance area resting 15300.
A break higher here could lead us closer to the YTD high with resistance at 15600 and 16000 respectively.
NAS100 Daily Chart – October 10, 2023

Source: TradingView, Chart Prepared by Zain Vawda
IG CLIENT SENTIMENT
Taking a quick look at the IG Client Sentiment, Retail Traders have shifted to a more bullish stance with 51% of retail traders now holding long positions. Given the Contrarian View to Crowd Sentiment Adopted Here at DailyFX, is this a sign that the SPX may continue to fall?
For a more in-depth look at Client Sentiment on the SPX and how to the best use get your complimentary.
| Change in | Longs | Shorts | OI |
| Daily | -4% | 9% | 2% |
| Weekly | -10% | 15% | 1% |
Written by: Zain Vawda, Markets Writer for DailyFX.com
Contact and follow Zain on Twitter: @zvawda


Comments are closed.