S&P 500 down forty points after Hawkish Fed knocks back equities
- S&P 500 falls alongside major US equity indexes on Fed outlook.
- Federal Reserve holds rates steady at 5.5%, but sees rates higher longer.
- US equities declined across the board on Wednesday after the Federal Reserve (Fed) signaled that rates might be staying higher for longer than previously expected.
Fed Chair Jerome Powell stood pat on interest rates, leaving the benchmark rate at 5.5% as markets broadly expected, but the Federal Open Market Committee (FOMC) raised their rate projections looking forward, seeing 5.1% for 2024's end-of-year rate, versus the previous 4.6%.
Fed officials also signaled they might be raising rates one more time this year, but Fed head Powell noted that this could very well be the peak of the rate hike cycle.
Read more:
Jerome Powell speaks on monetary policy after deciding to hold interest rate steady
Fed dot plot points to one more 25 bps hike in 2023 and 50 bps cut in 2024
Prior to Wednesday's Fed showing, markets were anticipating a full percentage point cut from the Fed by the end of 2024, rather than the half-point currently on the books.
The Standard and Poor's (S&P) 500 equity index slid 40 forty points through Wednesday, ending the day down 0.94% into $4,402.20.
The NASDAQ Composite index tumbled 1.53% to end the day at $13,469.13, while the Dow Jones Industrial Average (DJIA) managed to hold on through Wednesday, ending the day down a meager 0.22%. The DJIA closed out the Wednesday market session near $34,440.00.
S&P 500 technical outlook
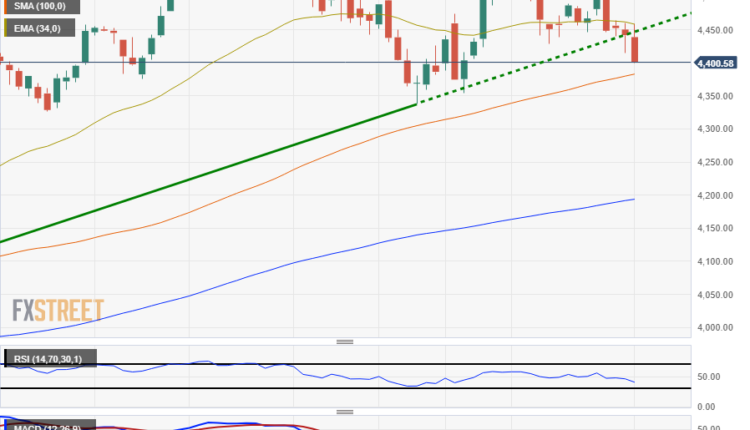
The S&P 500 spent much of the early part of Wednesday in the green, trading into $4,460.00 from the day's open near $4,440.00. However, the hawkish Fed outlook sent equities tumbling, sending the index down to close out the day at $4,400.
Hourly candles see the S&P 500 set to slide further after losing the week's bottom from $4,415.00, and a lower highs pattern is firming up on the charts.
On the daily candlesticks, the S&P 500 is set to take a run into the 100-day Simple Moving Average (SMA) near $4,382.00, while the 200-day SMA rests far below current price action near $4,200.00.
S&P 500 daily chart

S&P 500 technical levels


Comments are closed.