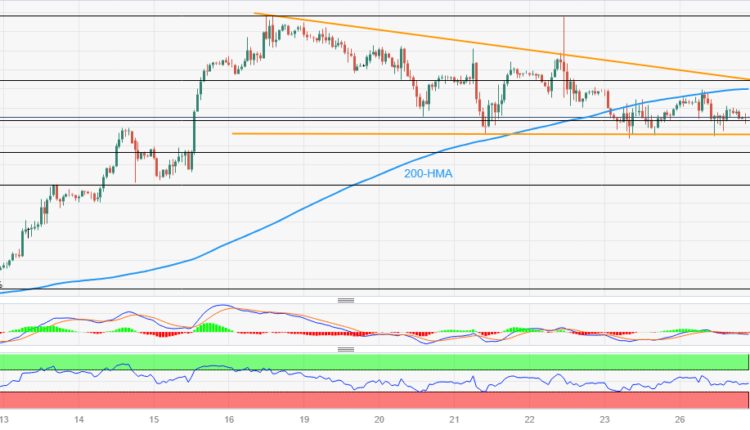
Slides towards 1.2690 horizontal support within weekly triangle
- GBP/USD remains depressed within a one-week-old bullish triangle.
- Downbeat oscillators, failure to cross 200-HMA keep Cable bears hopeful.
- Upside break of 1.2765 confirms bullish chart formation suggesting fresh monthly high.
GBP/USD remains defensive within a one-week-old bullish triangle formation, sidelined near 1.2710 amid early hours of Tuesday’s Asian session.
That said, the bullish triangle formation lures the Cable buyers. However, multiple failures to cross the 200-Hour Moving Average (HMA) joins the bearish MACD signals and the steady RSI (14) line to keep the GBP/USD sellers hopeful of breaking the stated triangle’s support line, close to 1.2690 by the press time.
Following that, the 61.8% Fibonacci retracement of June 12 to 22 uptrend, near 1.2625, will precede the 1.2600 round figure to restrict further downside of the GBP/USD price.
In a case where the Pound Sterling remains bearish past 1.2600, the month-start swing high of near 1.2545 will be in the spotlight.
On the contrary, the 200-HMA and the stated triangle’s top line, respectively near 1.2750 and 1.2765, restrict immediate upside of the GBP/USD pair.
It’s worth noting that the Pound Sterling rise past 1.2765 confirms the bullish chart formation and will direct the GBP/USD price towards the theoretical target of 1.2850.
Overall, GBP/USD fades upside momentum but the sellers need validation from 1.2690 to welcome the bears.
GBP/USD: Hourly chart
Trend: Downside expected


Comments are closed.