

Simple neural network autoencoder with candlesticks and 🍺 – Neural Networks – 7 April 2023
Warning :
- this is my first attempt at an autoencoder
- i've seen a video or 2 on autoencoders so i might butcher this
With that out of the way let's pop a beer open and grab the keyboard.
What are we building :
We will snatch the world's silliest simplest weakest most bare-bone thinnest neural net ever , the one we built here,
and we will attempt this :
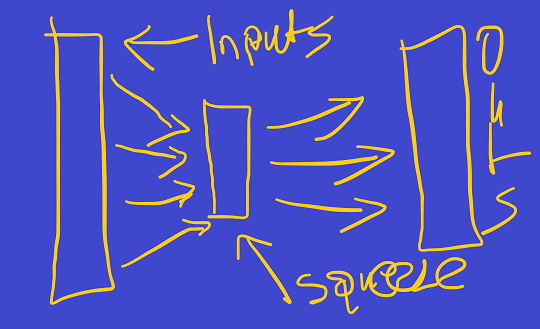
wtf is that , you ask .
This is a neural net that has some inputs , like most nets , but , the goal of the network is to recreate the inputs it received on the other end of the “squeeze”.
Yes , you are correct this is like compression , sort of .
So what are we going to send in ?
A sequence of 20 bars !!!
How : ? :
- We will get the min and max price for a window of 20 bars.
- We will calculate the range of that window max-min
- Then for each bar we will calculate this value : (close-open)/range producing a value between -1.0 and 1.0
- We will send these 20 values as inputs for each window
- and each 20 bar window will be a sample
Cool let's create our sample collector real quick , simple sh*t from the ohlc history of the chart.
#property version   "1.00"
#include "miniNeuralNet.mqh";


    class ae_sample{
           public:
    double min,max,range;
    double bars[];
           ae_sample(void){reset();}
          ~ae_sample(void){reset();}
      void reset(){
           ArrayFree(bars);
           min=INT_MAX;
           max=INT_MIN;
           range=0.0;
           }
      void fill(int oldest_bar,int size){


               ArrayResize(bars,size,0);
               ArrayFill(bars,0,size,0.0);
               int co=-1;
               for(int i=oldest_bar;i>oldest_bar-size;i--){
                  co++;
                  if(iHigh(_Symbol,_Period,i)>max){max=iHigh(_Symbol,_Period,i);}
                  if(iLow(_Symbol,_Period,i)<min){min=iLow(_Symbol,_Period,i);}
                  bars[co]=iClose(_Symbol,_Period,i)-iOpen(_Symbol,_Period,i);
                  }

                 range=max-min;

                 for(int i=0;i<size;i++){
                    bars[i]/=range;

                    bars[i]=(bars[i]+1.0)/2.0;
                    }

           }
    };
Basic stuff :
- imported the little net
- then a simple (and naive) extractor of chart data for a given window which fills a sample
- the inputs match the outputs here for each sample (bars[] is both of these)
We now need a little sample collection , we won't have many samples now that i think of it but its okay , still more fun than netflix. sco
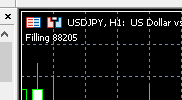
    struct ae_sample_collection{
    ae_sample samples[];
              ae_sample_collection(void){reset();}
             ~ae_sample_collection(void){reset();}
         void reset(){
              ArrayFree(samples);
              }
         void add_sample(int oldest_bar,int window_size){
              int ns=ArraySize(samples)+1;
              ArrayResize(samples,ns,0);
              samples[ns-1].fill(oldest_bar,window_size);
              }
          int fill(int window_size){

                int barz=iBars(_Symbol,_Period);
                if(barz>TerminalInfoInteger(TERMINAL_MAXBARS)){barz=TerminalInfoInteger(TERMINAL_MAXBARS);}


                  int samples_possible=barz-window_size;
                  if(samples_possible>1000){

                    int co=-1;
                    ArrayResize(samples,samples_possible,0);
                    for(int i=barz-1;i>=(1+window_size);i--){
                       Comment("Filling "+i);
                       co++;
                       samples[co].fill(i,window_size);

                       }
                    ArrayResize(samples,co+1,0);
                  }
              return(ArraySize(samples));
              }
    };
Simple stuff , we want completed bars only so 1 can be the last bar in a sample , this may be slow because we are not presizing , but anyway
🍰
now , chart initializes , we delete all the objects with our tag we setup a timer , we catch the samples on timer .
    ae_sample_collection COLLECTION;
snn_net net;
#define SYSTEM_TAG "AE_"
bool Loaded=false;
int OnInit()
  {

  COLLECTION.reset();
  net.reset();
  Loaded=false;
  ObjectsDeleteAll(ChartID(),SYSTEM_TAG);
  EventSetMillisecondTimer(544);

   return(INIT_SUCCEEDED);
  }

void OnTimer(){
  if(!Loaded){
  EventKillTimer();
  if(COLLECTION.fill(20)>=1000){
  Comment("Samples created ");


  }else{
  Alert("Too little samples");
  ExpertRemove();
  }
  }
  else{

  }
  }


void OnDeinit(const int reason)
  {

  COLLECTION.reset();
  net.reset();
  ObjectsDeleteAll(ChartID(),SYSTEM_TAG);
  }
Cool , if the collection does not fill , bounce … now we need to setup the network ….

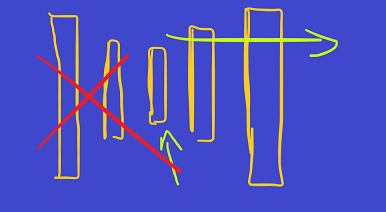
Let's try with a 3-2-3 in the middle , not expecting much ,but lets start there , so
20-3-2-3-20 , jesus
      net.add_layer().setup(20);

      net.add_layer().setup(3,20);

      net.add_layer().setup(2,3);

      net.add_layer().setup(3,2);

      net.add_layer().setup(20,3);
Okay but how will we play with this ? It has to do stuffy stuff and learn and then we gotta be able to nudge the
“encoding” (the middle layers) and see what they product , for fun , so we need :
- an indication of the loss avg
- a little custom display that can display 20 columns , you see where this is going
- the middle layer with the 2 nodes outputs 0.0 to 1.0 as it has sigmoid activations
so what if we have 2 inputs that at any point we can adjust and they will spit out - the 20 bars (well the open to close size within a range really) it thinks we are sending (but we are not sending anything really 3:) )
- a beer
Good , the loss function can be an indication with the comment function ,then 2 edits and a resource.
Let's start there , a box to which we send bar-sizes of a % to its sides size and we plot the “logical” sequence of them
hopefully , if we get out of bounds we'll need to extend the “hypothetical canvas” though because we need to see.
Okay less typing more typing :
void create_fake_chart(double &fake_bars[],
                       uint &pixels[],
                       int &side_size,
                       color bgColor,
                       color upColor,
                       color dwColor
                       ){

  ArrayFill(pixels,0,ArraySize(pixels),ColorToARGB(bgColor,255));

  double tfb=((double)ArraySize(fake_bars));
  double bar_size=((double)side_size)/(((tfb+1.0)/2.0)+tfb);
  double gap_size=bar_size/2.0;


  double start_x=gap_size;


}
Soon we run into our first realization :
We don't know the starting “y” or “fake price” of the output , we just know its supposed to have 1.0 on top as max and 0.0 on the bottom as min
So we'll “center it” or something ? , let's see , let's log the overall min and max and start from 1.0
  double emu_max=INT_MIN,emu_min=INT_MAX;

    double price_now=1.0;


    for(int i=0;i<ArraySize(fake_bars);i++){
       price_now+=fake_bars[i];
       if(price_now>emu_max){emu_max=price_now;}
       if(price_now<emu_min){emu_min=price_now;}
       }
kay so we do thiiis and we have the “emulated max” and emulated min …. now what …
hmmm , okay we need to turn the sizes to price points , so we should convert to close prices and
then we will normalize them into the range 0.0 to 1.0 , which does not take into account the original range had taken highs and lows into account but this is a test so , let's just go with it.
So change this to “prices” , we change the loop to this , we add open and close price , the first open price is 1.0
    double fake_bars_open_price[],fake_bars_close_price[];
    ArrayResize(fake_bars_open_price,ArraySize(fake_bars),0);
    ArrayResize(fake_bars_close_price,ArraySize(fake_bars),0);
    for(int i=0;i<ArraySize(fake_bars);i++){

         fake_bars_open_price[i]=price_now;

         price_now+=fake_bars[i];

         fake_bars_close_price[i]=price_now;
       if(price_now>emu_max){emu_max=price_now;}
       if(price_now<emu_min){emu_min=price_now;}
       }
Okay now , to turn from 0.0 to 1.0 we get the range , we loop into each bar (which is now a price point) , we subtract the minimum , we divide by the range and that's it .
and we do this :
    double range=emu_max-emu_min;
    for(int i=0;i<ArraySize(fake_bars);i++){
      fake_bars_open_price[i]=(fake_bars_open_price[i]-emu_min)/range;
      fake_bars_close_price[i]=(fake_bars_close_price[i]-emu_min)/range;
      }
annoying but needed . now … we gotta draw this … %^$#!^$#$ , let's cheat … we open the canvas
we find the fill rectange and we steal it …. 😇 this is what it looks like , let's make it less civilized , send it a pixels array , width +height .sco
void ResourceFillRectangle(int x1,int y1,int x2,int y2,const uint clr,uint &m_pixels[],int m_width,int m_height)
  {
   int tmp;

   if(x2<x1)
     {
      tmp=x1;
      x1 =x2;
      x2 =tmp;
     }
   if(y2<y1)
     {
      tmp=y1;
      y1 =y2;
      y2 =tmp;
     }

   if(x2<0 || y2<0 || x1>=m_width || y1>=m_height)
      return;

   if(x1<0)
      x1=0;
   if(y1<0)
      y1=0;
   if(x2>=m_width)
      x2=m_width -1;
   if(y2>=m_height)
      y2=m_height-1;
   int len=(x2-x1)+1;

   for(; y1<=y2; y1++)
      ArrayFill(m_pixels,y1*m_width+x1,len,clr);
  }
good that annoyance is gone too , now the last one pass the fake bars to the pixels
we must be careful here , the pixels y axis has 0 on top and 1.0 at the bottom , so we have to flip it!
        uint upc=ColorToARGB(upColor,255);
        uint doc=ColorToARGB(dwColor,255);
    for(int i=0;i<ArraySize(fake_bars)-1;i++){


        double y_open=side_size-fake_bars_open_price[i]*((double)side_size);
        double y_close=side_size-fake_bars_close_price[i]*((double)side_size);
        uint colorused=upc;
        if(fake_bars_open_price[i]>fake_bars_close_price[i]){colorused=doc;}

        int x1=(int)start_x;
        int x2=(int)(start_x+bar_size);
        int y1=(int)MathMin(y_open,y_close);
        int y2=(int)MathMax(y_open,y_close);
        ResourceFillRectangle(x1,y1,x2,y2,colorused,pixels,side_size,side_size);
      }
So what did we do here :
- We multiplied the 0.0 to 1.0 open with the side size .(so a value from 0 to side size)
- We subtracted that from the side size to flip it , so , if it grows it moves up not down
- We did the same for the close price and now we had the open y and close y
- We assign the proper color based on whether or not it goes up or down
- and we draw it
Good , it might work , now we need to build our “deck” the 2 inputs and the output resource and bitmap label.
Okay we add an input for the size , a pixels array called display ,we free a display resource on init and exit , we create a bmp label and 2 inputs .
input int display_size=300;

uint display[];


      int py=30;
      for(int i=0;i<2;i++){
      string name=SYSTEM_TAG+"_NODE"+IntegerToString(i);
      ObjectCreate(ChartID(),name,OBJ_EDIT,0,0,0);
      ObjectSetInteger(ChartID(),name,OBJPROP_XSIZE,150);
      ObjectSetInteger(ChartID(),name,OBJPROP_YSIZE,20);
      ObjectSetInteger(ChartID(),name,OBJPROP_XDISTANCE,10);
      ObjectSetInteger(ChartID(),name,OBJPROP_YDISTANCE,py);
      ObjectSetInteger(ChartID(),name,OBJPROP_BGCOLOR,clrDarkKhaki);
      ObjectSetInteger(ChartID(),name,OBJPROP_BORDER_COLOR,clrGold);
      ObjectSetInteger(ChartID(),name,OBJPROP_COLOR,clrYellow);
      ObjectSetString(ChartID(),name,OBJPROP_TEXT,"(Node "+IntegerToString(i)+" output) :");
      py+=20;
      }
      string name=SYSTEM_TAG+"_DISPLAY";
      ObjectCreate(ChartID(),name,OBJ_BITMAP_LABEL,0,0,0);
      ObjectSetInteger(ChartID(),name,OBJPROP_XSIZE,display_size);
      ObjectSetInteger(ChartID(),name,OBJPROP_YSIZE,display_size);
      ObjectSetInteger(ChartID(),name,OBJPROP_XDISTANCE,10);
      ObjectSetInteger(ChartID(),name,OBJPROP_YDISTANCE,py);
      ObjectSetString(ChartID(),name,OBJPROP_BMPFILE,"::DISPLAY");
      ChartRedraw();
Great , now we will :
- start a timer interval and train on samples every interval , then update the user (us) on the loss
- we will create a pause / continue situation for the “learning” so we can pause the training and play with the node outputs
- everytime the inputs change (for the node outputs) manually we draw the outcome if the training is paused
That means the inputs are hidden by default and there should be a pause button above them , hopefully the last mods we do , we set the loaded indication as true we add a busy indication and we are good to go .
So we add these 2 parameters on top
input bool reset_stats_after_batch=true;
input double base_learning_rate=0.001;
Then a switch to indicate training is not paused
bool Train=false;
and this is what the training block looks like :
  if(!SystemBusy&&Train){
  SystemBusy=true;


    int ix=0;
    for(int i=0;i<ArraySize(COLLECTION.samples);i++)
     {

       ix+=MathRand();
       while(ix>=ArraySize(COLLECTION.samples)){ix-=ArraySize(COLLECTION.samples);}

       net.feed_forward(COLLECTION.samples[ix].bars);

       net.calculate_loss(COLLECTION.samples[ix].bars);

       net.back_propagation();
     }

     double max_loss=net.get_max_loss_per_sample();
     double cur_loss=net.get_current_loss_per_sample();
     double a=(cur_loss/max_loss)*base_learning_rate;
     net.adjust(a);
     if(reset_stats_after_batch){net.reset_loss();}
     string comm="Loss ("+cur_loss+")/("+max_loss+")";
     Comment(comm);

  SystemBusy=false;
  }
Okay , now , lastly , when the pause button is hit we :
- change it to “Continue”
- show the 2 node inputs
- show the display block
- set Train to false
We add a chart event block for this :
void OnChartEvent(const int id,const long& lparam,const double& dparam,const string& sparam)
  {
  if(Loaded&&id==CHARTEVENT_OBJECT_CLICK){
    if(sparam==SYSTEM_TAG+"_PAUSE"&&Train){
      ObjectSetString(ChartID(),SYSTEM_TAG+"_PAUSE",OBJPROP_TEXT,"Continue");
      for(int i=0;i<middleNodes;i++){
         ObjectSetInteger(ChartID(),SYSTEM_TAG+"_NODE"+IntegerToString(i),OBJPROP_TIMEFRAMES,OBJ_ALL_PERIODS);
         }
      ObjectSetInteger(ChartID(),SYSTEM_TAG+"_DISPLAY",OBJPROP_TIMEFRAMES,OBJ_ALL_PERIODS);
      Train=false;
      }else if(sparam==SYSTEM_TAG+"_PAUSE"&&!Train){
      ObjectSetString(ChartID(),SYSTEM_TAG+"_PAUSE",OBJPROP_TEXT,"Pause");
      for(int i=0;i<middleNodes;i++){
         ObjectSetInteger(ChartID(),SYSTEM_TAG+"_NODE"+IntegerToString(i),OBJPROP_TIMEFRAMES,OBJ_NO_PERIODS);
         }
      ObjectSetInteger(ChartID(),SYSTEM_TAG+"_DISPLAY",OBJPROP_TIMEFRAMES,OBJ_NO_PERIODS);
      Train=true;
      }
    }
  }
aand now , when we detect a change in inputs recalculate the pixels and recreate the resource , and hopefully it works.
But wait , we must include a function in the network that feeds forward from a layer onwards . Why ?
Because we hijack the middle layer's output and we want to see what it spits out on the other end – and plot it
That's an easy config :
      void partial_feed_forward(int from_layer_ix){
           for(int i=from_layer_ix;i<ArraySize(layers);i++){
              layers[i].feed_forward(layers[i-1]);
              }
           }
Simple , we see that the feed forward will start from the layer we send in so if we filled outputs for the layer the arrow is pointint up to then we will start from the next layer , so 0 , 1, 2 ,thats layer 3 .
And we will fill up a “fake bars” array to send down to the plotter. we don't forget our output is between 0.0 and 1.0 and we need to turn it to -1.0 to 1.0
  else if(Loaded&&id==CHARTEVENT_OBJECT_ENDEDIT){

      if(StringFind(sparam,SYSTEM_TAG+"_NODE",0)!=-1){
        for(int i=0;i<middleNodes;i++){

             double v=(double)StringToDouble(ObjectGetString(ChartID(),SYSTEM_TAG+"_NODE"+IntegerToString(i),OBJPROP_TEXT));

             if(v<0.0){v=0.0;}else if(v>1.0){v=1.0;}

             net.layers[2].nodes[i].output=v;
           }

          net.partial_feed_forward(3);

          double fake_bars[];
          ArrayResize(fake_bars,20,0);
          for(int i=0;i<20;i++){fake_bars[i]=net.get_output(i);}

          for(int i=0;i<20;i++){fake_bars[i]=(fake_bars[i]*2.0)-1.0;}
          create_fake_chart(fake_bars,display,display_size,clrBlack,clrGreen,clrCrimson);

            if(ResourceCreate("DISPLAY",display,display_size,display_size,0,0,display_size,COLOR_FORMAT_ARGB_NORMALIZE)){
              ChartRedraw();
              }
        }
    }
Then we create the resource , redraw the chart .But it would be convenient to throw that into a function because we may need
to call it elsewhere too so :
void calculate_fake_chart(){
        for(int i=0;i<middleNodes;i++){

             double v=(double)StringToDouble(ObjectGetString(ChartID(),SYSTEM_TAG+"_NODE"+IntegerToString(i),OBJPROP_TEXT));

             if(v<0.0){v=0.0;}else if(v>1.0){v=1.0;}

             net.layers[2].nodes[i].output=v;
           }

          net.partial_feed_forward(3);

          double fake_bars[];
          ArrayResize(fake_bars,20,0);
          for(int i=0;i<20;i++){fake_bars[i]=net.get_output(i);}

          for(int i=0;i<20;i++){fake_bars[i]=(fake_bars[i]*2.0)-1.0;}
          create_fake_chart(fake_bars,display,display_size,clrBlack,clrGreen,clrCrimson);

            if(ResourceCreate("DISPLAY",display,display_size,display_size,0,0,display_size,COLOR_FORMAT_ARGB_NORMALIZE)){
              ChartRedraw();
              }
}
and we add a call when we pause the learnign and when we update the node values manually.neat
Well as expected , there is a bottleneck in samples filling up
So we'll have to presize the samples in the collection …. but , bright side we'll get 90k samples , that's good , will be slow af but good.
So we are changing the fill function of the sample collector to this :
          int fill(int window_size){

                int barz=iBars(_Symbol,_Period);
                if(barz>TerminalInfoInteger(TERMINAL_MAXBARS)){barz=TerminalInfoInteger(TERMINAL_MAXBARS);}


                  int samples_possible=barz-window_size;
                  if(samples_possible>1000){

                    int co=-1;
                    ArrayResize(samples,samples_possible,0);
                    for(int i=barz-1;i>=(1+window_size);i--){
                       Comment("Filling "+i);
                       co++;
                       samples[co].fill(i,window_size);

                       }
                    ArrayResize(samples,co+1,0);
                  }
              return(ArraySize(samples));
              }
Now this run into nan -nan errors at first , so , theres issues in the sample collection , you won't see them as i'll edit the code snippets.
The second run was better , it converged faster and had no weird alien numbers , and it kinda looks like a real chart when you hit pause .
And it looks like price action when we manually tune the nodes in the middle
of course one can say , bruh , everything that comes out of the output could be plotted as price action . true.
Let's see if we can animate this sh*t , and understand what the 2 knobs …

what the 2 nobs mean . That's how AIs are drawing things btw , all you gotta do (or it) is figure out what the little nodes in the middle tune.
So , let's add a button that stops training but starts animating next to the pause , we could make this look better but i can just go look in the mirror 😇 (jk) sco lets finish this.
we add the button ,we add the animating switch , and steps and current values for the nobs. the animator will be taking one step per timer entry and drawing it.
Lets see what happens :
hmm it looks price actiony
what if we start from different values for the nodes ?
There are combinations in there that could be describing different activity , so if one figures out what the encoder parameters do then you could be looking at an artificial training price feed for instance that resembles usdjpy (in this example)
Read more about the simplest neural net here


Comments are closed.