Silver Prices Draw Support from USD Weakness and Falling Yields, US CPI Eyed
SILVER PRICES FORECAST:
- Silver prices rally more than 3.5% after a subdued performance in the previous trading session
- The precious metal’s gains can be attributed to U.S. dollar weakness and falling Treasury yields
- This article looks at key XAG/USD’s technical levels worth watching in the coming days
| Change in | Longs | Shorts | OI |
| Daily | -4% | 22% | 0% |
| Weekly | -6% | 22% | -2% |
Most Read: Gold Price Setup – Can Stretched Long Positioning in XAU/USD Trump Technicals?
After a subdued performance on Wednesday, silver prices (XAG/USD) sprung back to life, rallying more than 3.5% to $24.37 an ounce on Thursday, bolstered by falling rates and a softer U.S. dollar.
In early afternoon trading, U.S. Treasury yields were underwater following disappointing economic data, which showed unemployment claims jumped sharply to 261,000 in the week ended June 3, the highest level since October 2021 and well above the pre-pandemic 2019 average of 218,000 applications.
Today's labor market figures suggest that layoffs may be gathering pace, a sign of a possible recession on the horizon. In any case, no grand conclusions should be drawn from a single weekly report, as the data can be noisy and contain outliers from time to time.
The move in bonds led to a broad-based drop in the greenback, sending the DXY index down 0.7% to its lowest point since May 23. In general, precious metals tend to do well when yields retreat and the U.S. dollar weakens, though the correlation is not perfect.
Looking ahead, the outlook for silver is likely to depend in part on the Fed’s tightening bias, with a dovish stance being positive and a hawkish posture negative for XAG/USD. That said, traders will have a clearer picture about the metal’s prospects next week when the Federal Reserve announces its June decision on Wednesday.
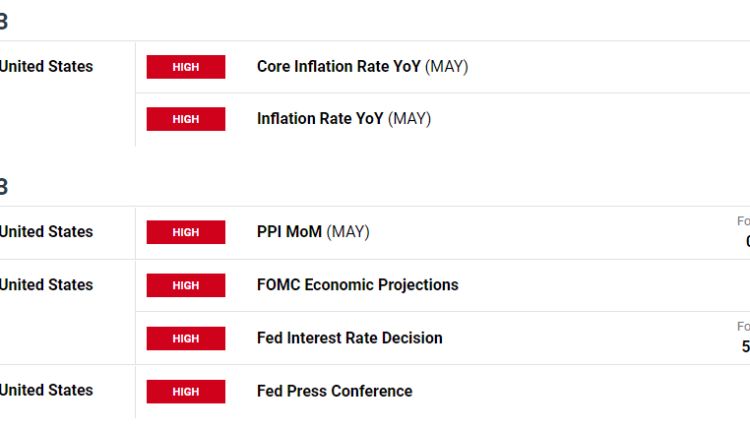
While the Fed is seen keeping its key rate steady at 5.00-5.25%, a pause is not yet a done deal. For instance, if May inflation data, which will be released on Tuesday, surprises to the upside, policymakers may ignore previous guidance and proceed with another quarter-point hike. This scenario could be quite bad silver.
Recommended by Diego Colman
Get Your Free USD Forecast
US ECONOMIC DATA NEXT WEEK
Source: DailyFX Economic Data
Recommended by Diego Colman
How to Trade Gold
SILVER TECHNICAL ANALYSIS
After Thursday’s strong rally, silver is steadily approaching an important resistance zone near 24.63/24.77, where the 50-day simple moving average converges with the January and February’s highs. If bulls manage to push prices higher and breach the ceiling mentioned before, upside pressure could pick up momentum, setting the stage for a move toward the 2023 highs.
On the flip side, if sellers regain control of the market and drive prices lower, initial support stretches from 22.96 to 22.70. If this floor caves in, bears could send the metal back towards its 200-day simple moving average near 22.15.
SILVER PRICES TECHNICAL CHART

Silver Futures Chart Prepared Using TradingView


Comments are closed.