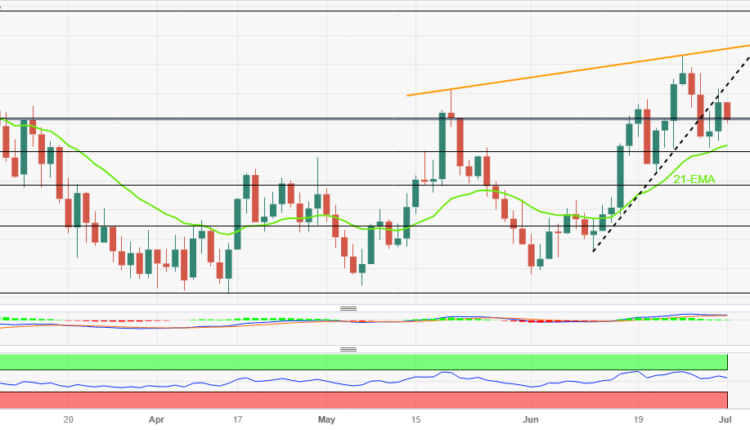
Reverses from support-turned-resistance towards $2.66
- Natural Gas Price prints the first daily loss in three while reversing from three-week-old previous support.
- Looming bear cross on MACD, descending RSI line add strength to downside bias targeting 21-EMA.
- 61.8% Fibonacci retracement checks XNG/USD bears; 1.5-month-old ascending resistance line appears key hurdle for Natural Gas buyers.
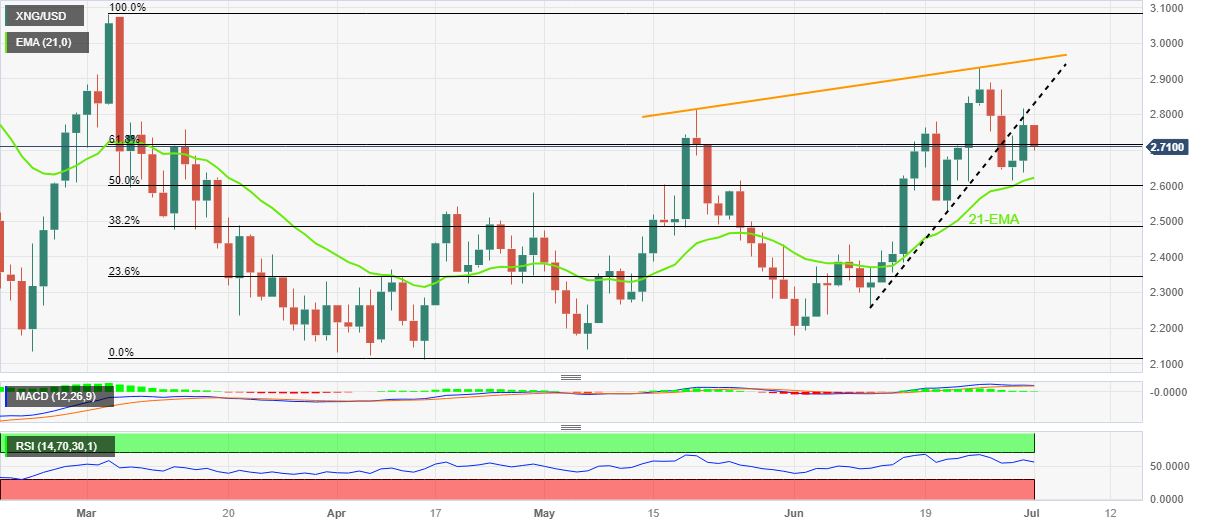
Natural Gas Price (XNG/USD) drops more than 2.0% to $2.71 early Monday as it snaps the previous day's two-day run-up while reversing from a six-week-old support-turned-resistance line.
Not only the XNG/USD’s U-turn from the previous support line but the impending bear cross on the MACD and downward-sloping RSI (14) line from the overbought territory add strength to the bearish bias about the Natural Gas Price.
However, the 21-Exonential Moving Average (EMA) level of $2.66 put a floor under the short-term XNG/USD price.
It’s worth noting that the 61.8% Fibonacci retracement of its March-April fall, near $2.71, limits the immediate downside of the Natural Gas Price whereas the 50% Fibonacci retracement level can act as additional support for the energy instrument near $2.60.
In a case where the XNG/USD remains bearish past $2.60, April’s peak of $2.58 will act as the last defense of the Natural Gas sellers.
On the contrary, a run-up beyond the previous support line, around $2.83 by the press time, isn’t an open invitation to the Natural Gas buyers as an upward-sloping resistance line from May 19, close to $2.95, will challenge the upside momentum before directing the price to March’s peak of near $3.08.
Also acting as an upside filter is the $3.00 psychological magnet.
Overall, the Natural Gas Price is likely to witness further downside but the room towards the south appears limited.
Natural Gas Price: Daily chart
Trend: Further weakness expected


Comments are closed.