
Dow Jones, S&P 500, Retail Trader Positioning, Technical Analysis – IGCS Equities Update
- Retail traders recently increased upside exposure on Wall Street
- Is this a sign the Dow Jones and S&P 500 are in trouble ahead?
- Dow Jones faces key rising trendline, S&P an Ascending Triangle
Recommended by Daniel Dubrovsky
Get Your Free Equities Forecast
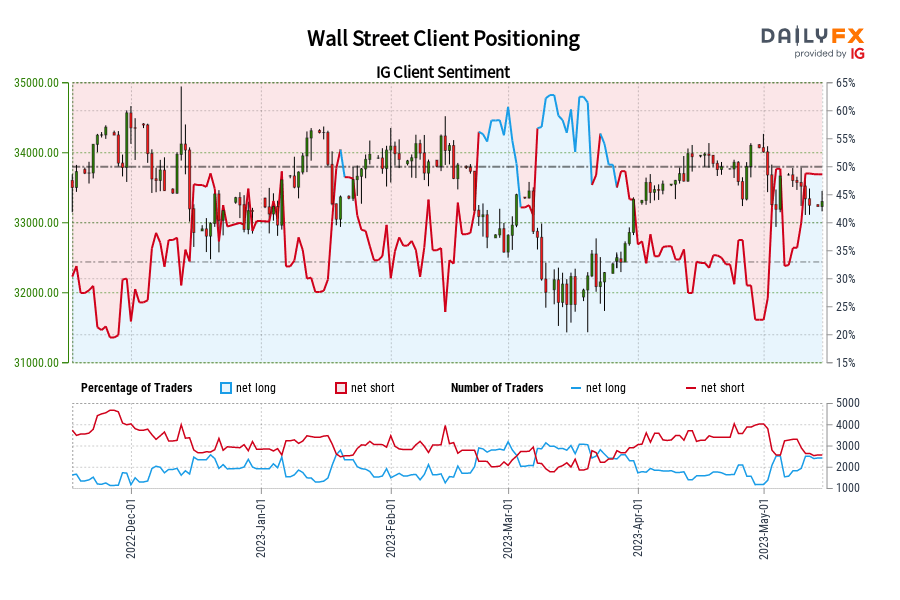
For the most part, the Dow Jones and S&P 500 have been maintaining range-bound price action since the end of last year. While price action might have been stable, retail trader positioning has been evolving. This can be seen by looking at IG Client Sentiment (IGCS). The latter can at times function as a contrarian indicator. With that in mind, let us take a closer look at what might come next.
Dow Jones Sentiment Outlook – Bearish
According to IGCS, about 49% of retail traders are net-long the Dow Jones. While narrow, since most traders are net-short, this hints prices may continue rising. But, upside exposure has increased by roughly 11% and 52% compared to yesterday and last week, respectively. With that in mind, recent changes in exposure hint that the price trend may soon reverse lower.

Dow Jones Technical Analysis
On the daily chart, the Dow Jones has continued making cautious downside progress since a Shooting Star candlestick pattern emerged in late April. Now, prices are facing a near-term rising trendline from March. A breakout lower could open the door to extending losses toward the 38.2% Fibonacci retracement level at 32709. Otherwise, key resistance is the 23.6% level at 33672.
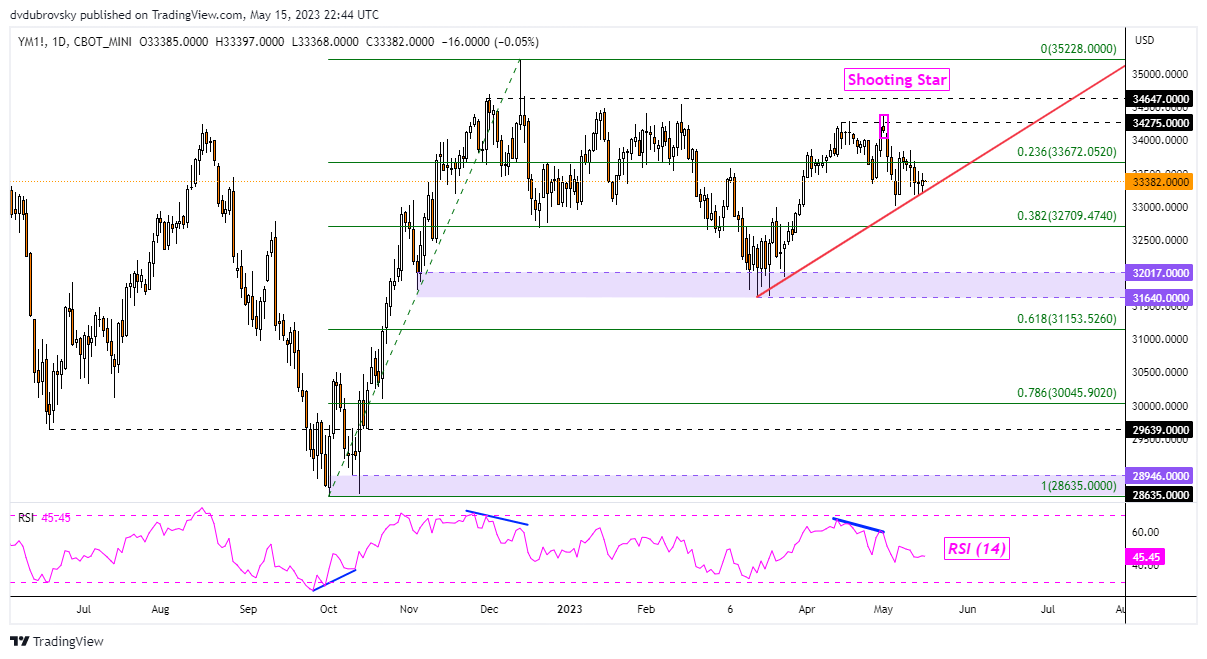
Chart Created in Trading View
S&P 500 Sentiment Outlook – Bearish
According to IGCS, about 37% of retail traders are net-long the S&P 500. Since most traders are biased lower, this hints prices may continue rising. Meanwhile, upside exposure increased by about 2% and 4% compared to yesterday and last week, respectively. With that in mind, recent adjustments in positioning hint that the current price trend may soon reverse lower despite overall exposure.
Recommended by Daniel Dubrovsky
Improve your trading with IG Client Sentiment Data

S&P 500 Technical Analysis
The S&P 500 continues to trade within the boundaries of an Ascending Triangle chart formation. From here, the floor of the triangle is slowly approaching. The direction of the breakout could be key for the coming trend. A turn lower exposes the 23.6% Fibonacci extension level at 4005. Otherwise, breaking higher may open the door to revisiting the August high at 4327.

Chart Created in Trading View
— Written by Daniel Dubrovsky, Senior Strategist for DailyFX.com
Comments are closed.