PNC Financial Services correction could provide investment opportunity
PNC Financial Services NYSE (PNC) is an American bank holding company and financial services corporation based in Pittsburgh, Pennsylvania. The stock is currently down 45% form all time highs. Investors are looking for clues into the current decline to prepare a plan for the next move. We’ll use the Elliott Wave Theory to define the technical structure and understand the potential path.
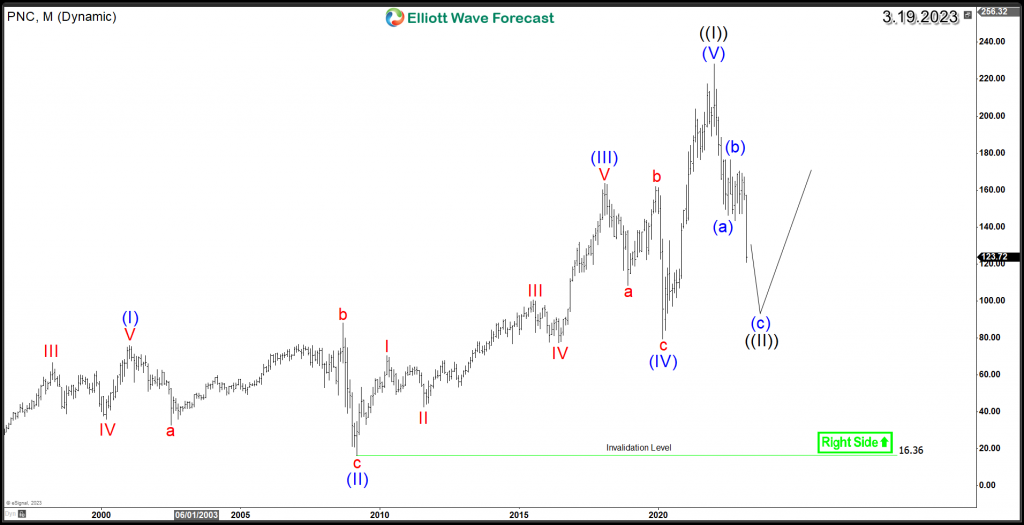
PNC monthly Elliott Wave chart

The above chart is showing the entire rally for PNC which ended last year after an impulsive 5 wave advance in wave ((I)). The stock started correcting the entire cycle with an initial 3 waves decline in wave ((II)). Correction unfold in 3 , 7 or 11 swings then the instrument is expected to either resume the rally or at least react in favor of the main trend. Investors will be looking for a potential opportunity at the end of wave ((II)), therefore they need to identify the structure of the decline.
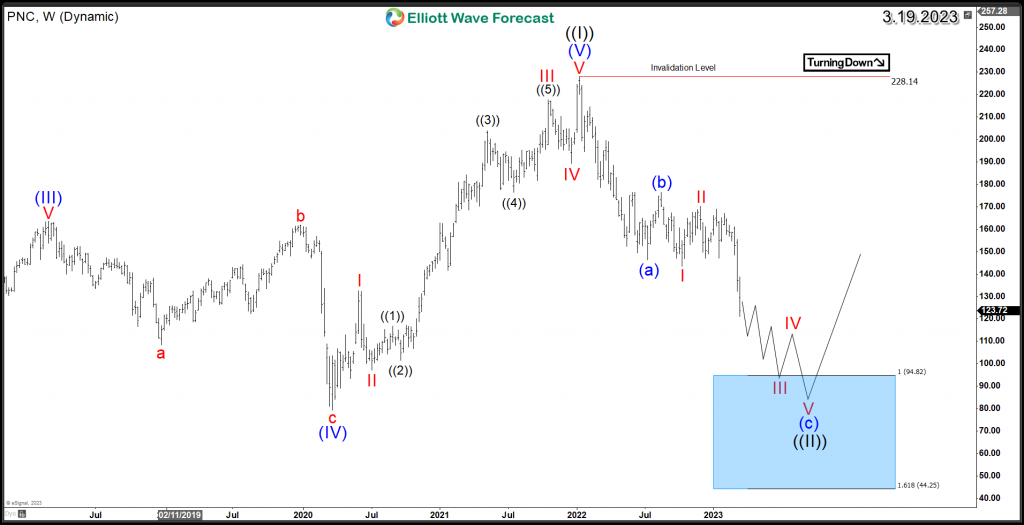
PNC weekly Elliott Wave chart

The decline since January 2022 peak is unfolding as a Zigzag Structure. PNC already created a bearish sequence since last year. The continuation took place recently after taking 10/10/2022 low. Wave (a) ended at 146.3 followed by wave (b) bounce at 176.3 and currently wave (c) taking place with an ideal target at equal legs area 94.8 – 44.2 as showing in the weekly chart. The blue boxes in our charts are the High-frequency areas where the Markets are likely to end cycles and make a turn. Therefore that area will provide significant support for PNC, as buyers and investors are expected to take positions and prepare for the next long term move.


Comments are closed.