Play of the Day: S&P 500 Index (US500) Bullish Trend Picking Up?
It looks like anti-dollar sentiment is building up ahead of the Jackson Hole Symposium.
Can this translate to more gains for the S&P 500?
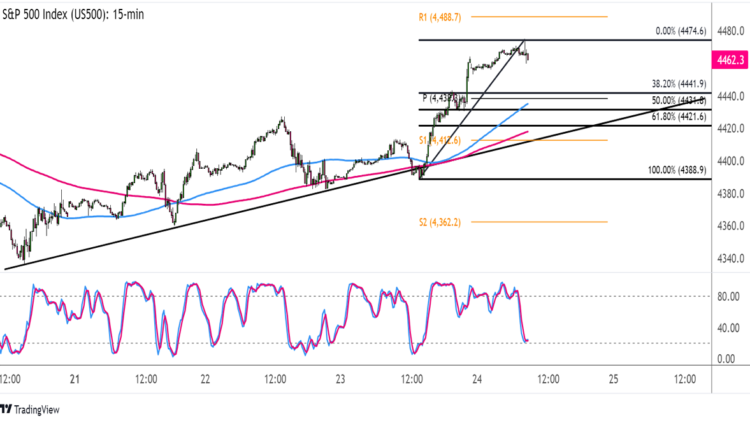
On its short-term time frame, you can see that the equity index has formed higher lows connected by an ascending trend line.

S&P 500 Index (US500) 15-min Chart by TV
A bullish correction may be in the works, and the Fibonacci retracement tool shows where more buyers might be hanging out.
The 38.2% level looks like a prime support zone, as it lines up with the pivot point (4,438.30) while the 61.8% Fib might be in the line in the sand for an uptrend pullback.
Now the latter is just slightly above S1 (4,412.60), the rising trend line, and the 200 SMA dynamic inflection point, so it might take a decent amount of bearish pressure to break below that level and spur a reversal.
Technical indicators are pointing to a continuation of the uptrend, too. The 100 SMA is above the 200 SMA to reflect the presence of bullish vibes while Stochastic is nearing the oversold region to indicate exhaustion among sellers soon.
So far, it looks like downbeat U.S. data such as the flash PMIs are fueling anti-dollar moves, which in turn are boosting risk assets like equities.
Market players might opt to ease up on their long stock positions leading up to the Jackson Hole Symposium, but many still seem to be expecting a shift to a more cautious Fed bias.
If that’s the case, the S&P 500 index might be poised to rally back to the swing high at 4,474.60 or even extend it up to R1 (4,488.70).
Better keep close tabs on sound bites from FOMC officials and Fed head Powell’s speech if you’re planning on trading this one!
This content is strictly for informational purposes only and does not constitute as investment advice. Trading any financial market involves risk. Please read our Risk Disclosure to make sure you understand the risks involved.


Comments are closed.