

US Core PCE Key Points
- Core PCE Price Index YoY (DEC) Actual 4.4% Vs 4.7% Previous.
- PCE Price Index YoY (DEC) Actual 5% Vs 5.5% Previous.
- The Probability of a Fed Funds Peak Rate Above 5% for 2023 Continues to Decline.
Recommended by Zain Vawda
Get Your Free USD Forecast
The CPI and Forex: How CPI Data Affects Currency Prices
Core PCE prices in the US, which exclude food and energy, went up by 0.3% month-over-month in December of 2022, picking up from the 0.2% increase in the prior month and in line with market estimates. Prices for goods increased 4.6 percent and prices for services increased 5.2 percent. Food prices increased 11.2 percent and energy prices increased 6.9 percent. Excluding food and energy, the PCE price index increased 4.4 percent from one year ago. This marks the slowest increase in 14 months. Today’s PCE print will add further pressure to the dollar as markets may see this as a sign the Fed may slow the pace of rate hikes earlier.

Customize and filter live economic data via our DailyFX economic calendar
High Importance US Economic Data on Tap Next Week
The US economy continues to defy expectations with this week’s initial jobless claims and GDP data both coming in positive. Is there a need for a slowdown of the hiking cycle from the US federal Reserve? This is the all-important question heading into next week’s meeting. The data continues to suggest that the ‘soft landing’ promise by the Fed may be possible, yet there remain some reasons for caution. Looking into the meat of US data and there are recessionary signs building with residential construction falling for the past 6 months, industrial production is down for the past 3 months, and retail sales have dropped by 1% or more in both November and December.
Trade Smarter – Sign up for the DailyFX Newsletter
Receive timely and compelling market commentary from the DailyFX team
Subscribe to Newsletter
The overall environment doesn’t seem to be as rosy of late with weak activity set to keep the Fed in check. Despite the hawkish nature of the Fed before their blackout period markets have adjusted their expectations of the Fed Funds Peak Rate for May 2023. Markets are now pricing in a 56% probability that the Fed Funds peak rate will be at 5% in May up from 40.8% a month ago. While the probability of a peak rate above 5% by December 2023 has fallen to 3.1% from 7.8% a month ago. These changes have seen the dollar index struggle of late as it remains at multi-month lows.
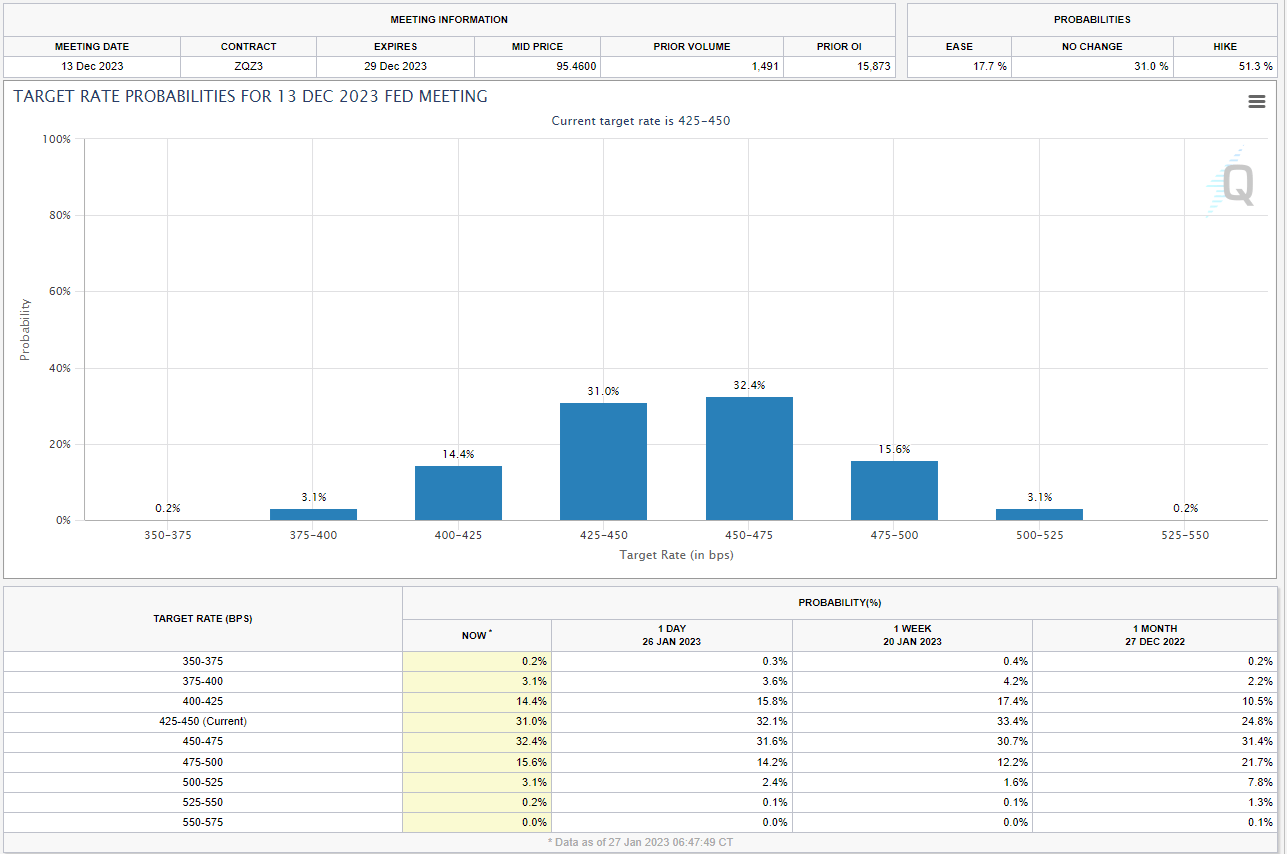
Source: CME Fedwatch Tool
Market Reaction Post-CPE Release
Following the data release the dollar index declined slightly slipping below the 102.00 level once more. The index has tried to recover since hitting the range low yesterday around 101.50 before bouncing higher.
We remain rangebound for the better part of 10 days now with yesterday’s GDP and todays PCE data unable to inspire a breakout. All eyes will be on whether the Federal Reserve meeting can inspire a breakout. Technically the longer a pair remains rangebound and consolidating the more volatile the breakout when it occurs, this maybe something to bear in mind heading into next week’s risk events.
Dollar Index Daily Chart – January 27, 2023
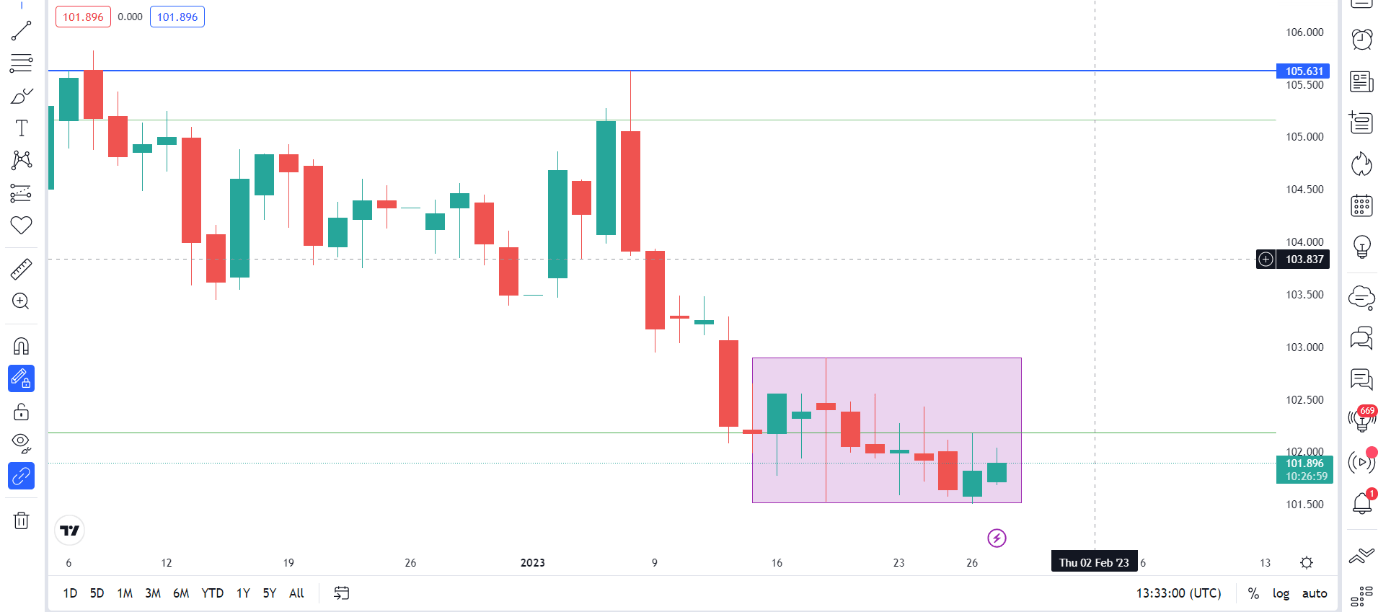
Source: TradingView, prepared by Zain Vawda
— Written by Zain Vawda for DailyFX.com
Contact and follow Zain on Twitter: @zvawda
Comments are closed.