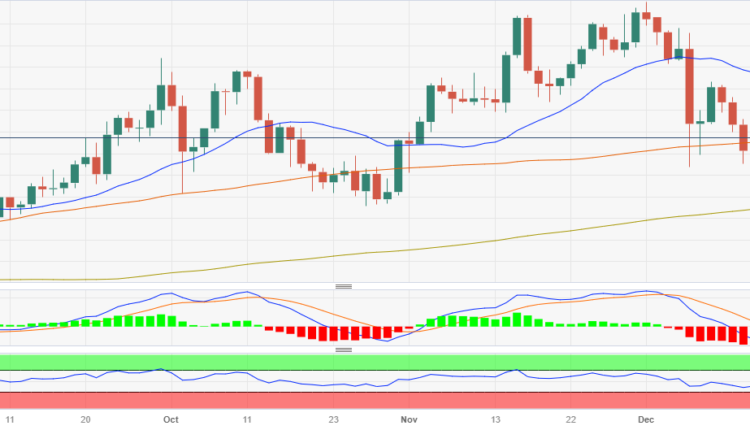
NZD/JPY sees slight gains and recovers 100-day SMA, bears take a breather
- The NZD/JPY hovers around 88.40, marking a gain of 0.30% after recent bearish pressure.
- Key indicators gain ground, but bears are still in command in the short term.
- Despite short-term hurdles, evident by residing below the 20-day SMA, the NZD/JPY pair remains within bullish controls in a larger context.
In Friday's session, the NZD/JPY made slight gains to 88.40 after dipping 1.30% over the past two days. Although the pair's daily chart reflects a neutral to bearish trend, buyers seem to have control of larger time frames. Meanwhile, the four-hour chart's indicators hint at a bolstering buying momentum, suggesting more upward movements in the next sessions.
On the daily chart view, the indicators send conflicting signals. Even though the pair is trading below the 20-day Simple Moving Average (SMA), hinting at a sense of weakness in the short-term perspective, it is holding position above both the long-term 100 and 200-day SMAs. This suggests that the bullish forces have the upper hand within the broader context. Nonetheless, the bears aren't ceding control so easily – their effort in the last two sessions has seen the pair take a 1.30% dip. The flat Moving Average Convergence Divergence (MACD) and the positively sloping, yet still below its middle point, Relative Strength Index (RSI) underline a rising buying momentum, but one where the bulls need to push harder to assert their control in the short term.
Moving to the four-hour chart, the indicators continue to reflect the same situation broadly. The Relative Strength Index (RSI) remains in the negative zone but its positive gradient suggests a potential for an upward shift in momentum. However, the MACD showing flat red bars emphasizes the need for a stronger surge from the buyers to set off a solid uptrend.
NZD/JPY daily chart
-638382728458633922.png)


Comments are closed.