Nvidia (NVDA) Made Rally After 3 Waves Pull Back
Hello fellow traders. In this technical article we’re going to take a look at the Elliott Wave charts of Nvidia (NVDA) , presented in members area of the of our website. Recently has given us 3 waves pull back as we were expecting. In the further text we are going to explain the Elliott Wave pattern and Forecast.
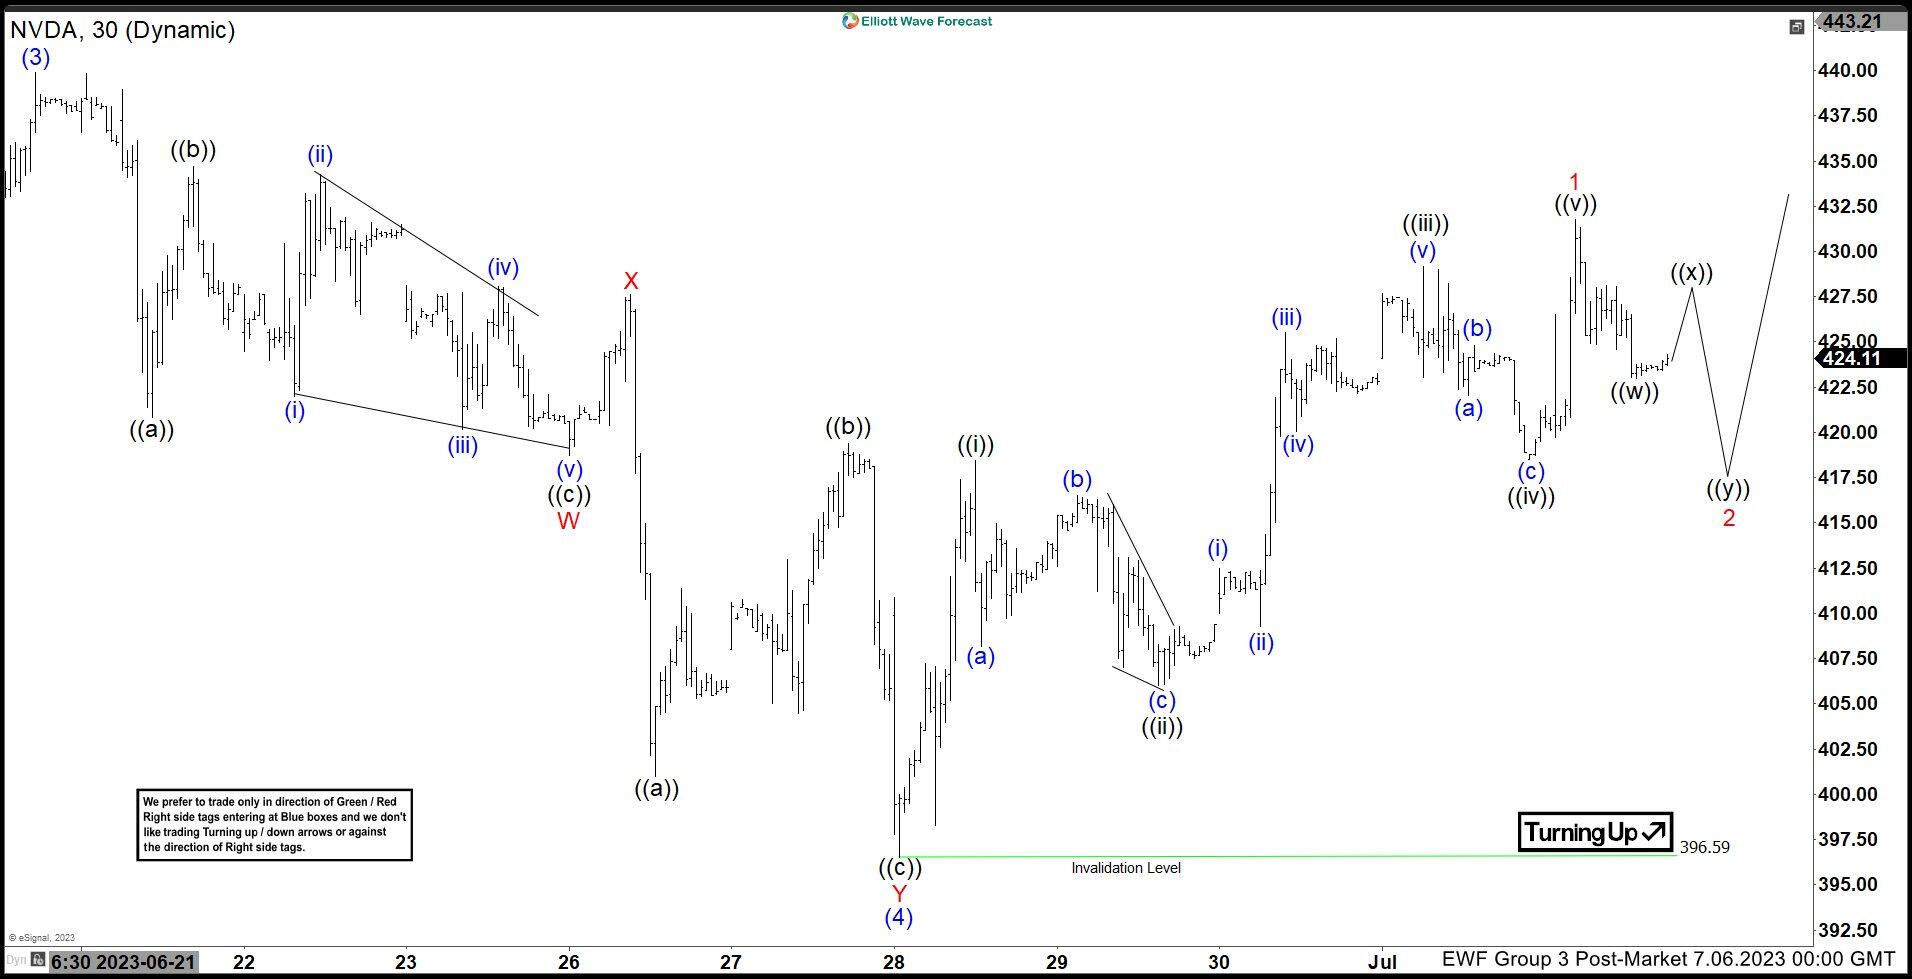
NVDA 1 Hour Elliott Wave Analysis 07.06.2023

NVDA ended cycle from the 396.59 low as 5 waves pattern. Current view suggests we are getting 3 waves pull back in 2 red correction. At the moment the price is ending first leg ((w)) of 2. We expect to see 3 waves bounce in ((x)) connector before final leg down ((y)) of 2 takes place. At this stage we still cannot use equal legs ((w))-((x)) as target because ((x)) connector is not formed yet. So, we will us 50-61.8 fib retracement zone for a potential target of 2 red pull back. That area comes at 414.12-409.9.
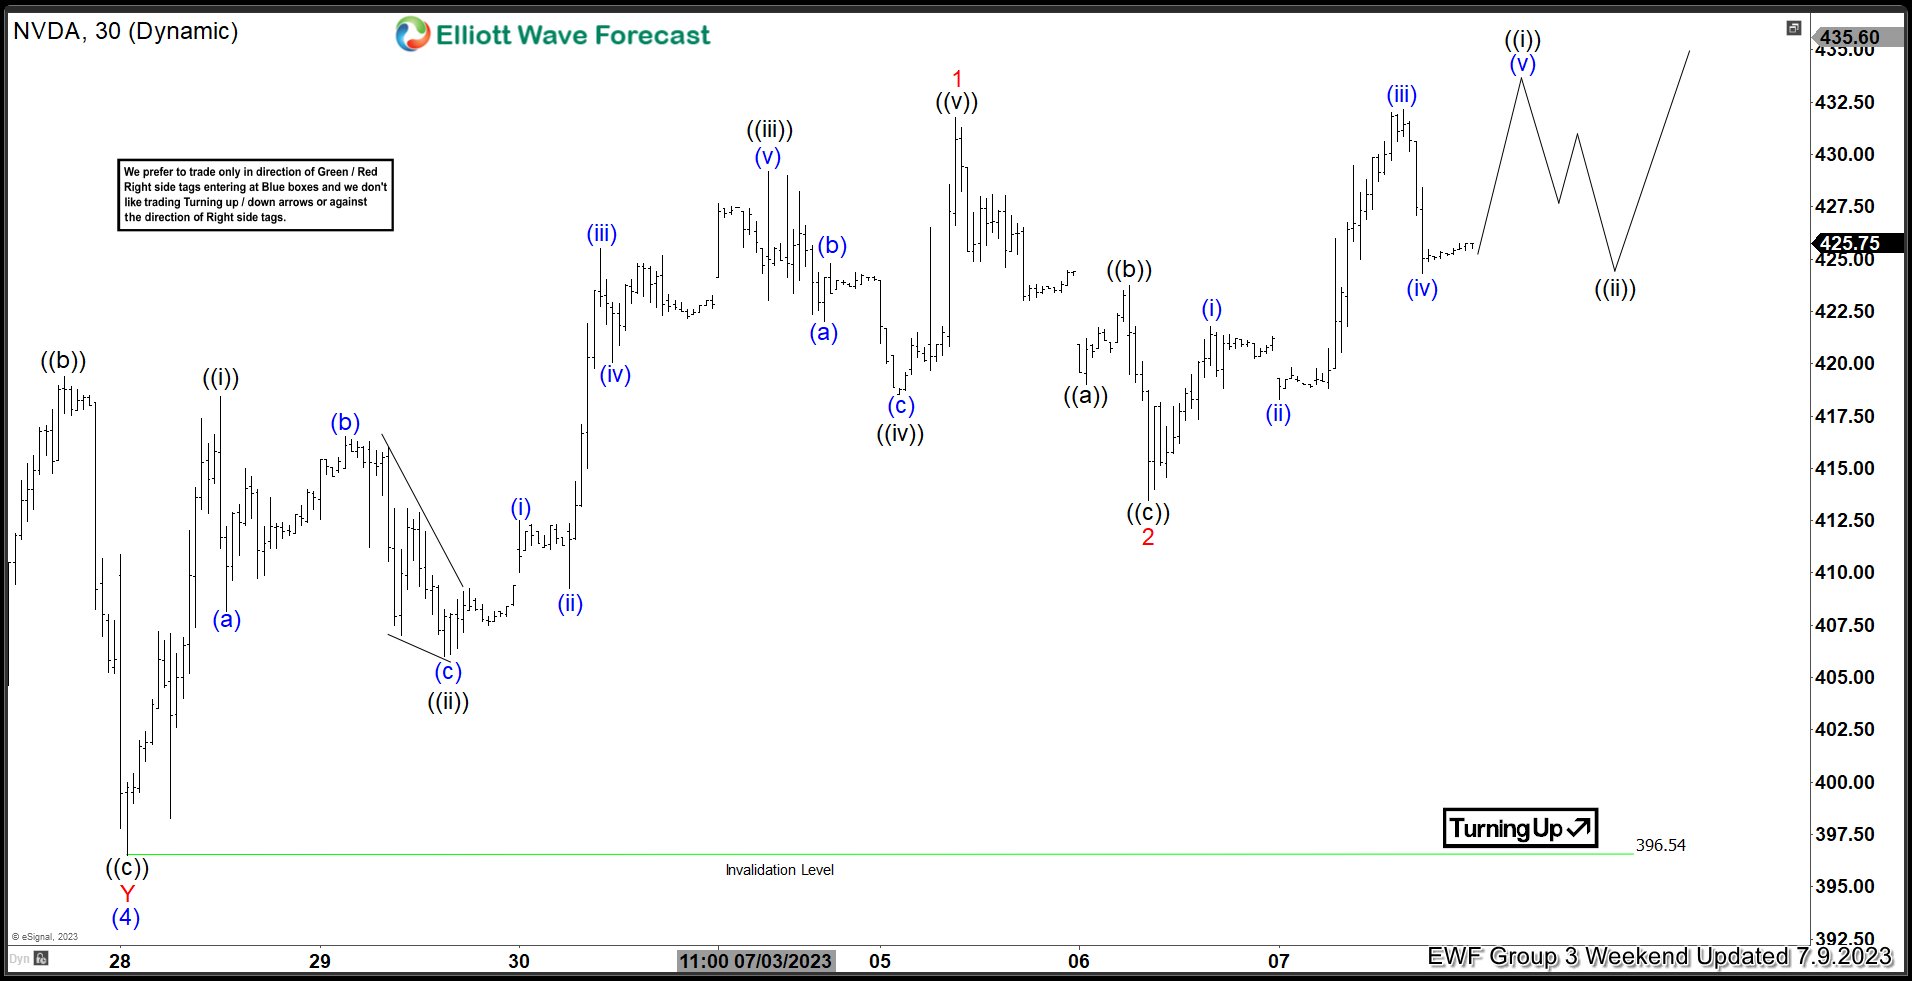
NVDA 1 Hour Elliott Wave Analysis 07.09.2023

Eventually the stock made 3 waves in wave 2 red correction. The stock reached our target zone, 50-61.8 fibs against the 396.5 low and completed there. Now as far as the price stays above 413.4 low, we can count wave 2 red completed and expect further extension up ideally. We would like to see break above June 20th high to confirm further strength in the stock. Once we get proposed break up, we can look to buy the stock again in 3,7,11 swings.
Keep in mind that market is dynamic and presented view could have changed in the mean time.


Comments are closed.