Nikkei ($NKD_F) should find extreme in wave 4 pullback soon [Video]
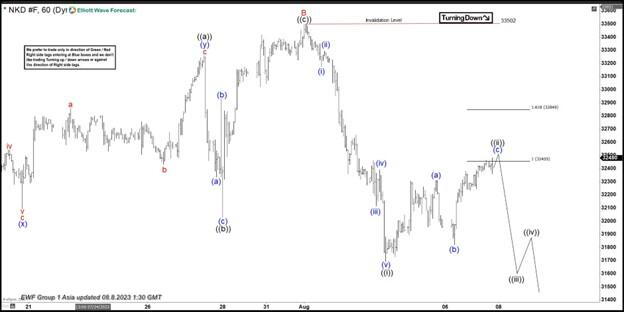
The Short term view in Nikkei futures ticket symbol: $NKD_F suggests that the index is doing a bigger pullback in wave (4) to correct the cycle from the 03 January 2023 low. The index is expected to find the extreme in the pullback soon. Before it can start the next leg higher or it does a 3-wave reaction higher at least. So far the pullback from the peak is unfolding as Elliott wave zigzag correction where wave A ended at 31800 low. Up from there, wave B bounce unfolded in a lesser degree flat correction with wave ((a)) completed at 33260 high. Wave ((b)) ended at 32030 low and then wave ((c)) ended in a lesser degree 5 waves at 33502 high thus completing wave B.
Down from there, the index made a new low below the previous wave A low. And confirmed the next extension in the C leg lower. Whereas the wave ((i)) ended at 31690 low in a lesser degree 5 waves impulse sequence. Above from there, the index is doing a bounce in wave ((ii)) in a lesser degree zigzag structure. Where small wave (a) ended at 32310. Wave (b) ended at 31820 and wave (c) should end between 32455- 32849 100%-161.8% Fibonacci extension area of (a)-(b). From there, the index is expected to resume the decline for a push towards 31274- 30748 bigger extreme area before it could resume higher again or ends up doing a 3-wave bounce minimum. Near-term, as far as bounces fail below 33502 high expect index to extend in C leg lower.
Nikkei 1 hour Elliott Wave chart from 8.08.2023

Nikkei Elliott Wave video


Comments are closed.